
TAO Technical Analysis
Analyzing the TAO chart, we can see that the price is still trading inside a long-term falling channel structure. Selling pressure continues while TAO is trying to hold around the mid-border of the channel, which increases the chance of a move toward the lower border. We see that the overall trend is still bearish.
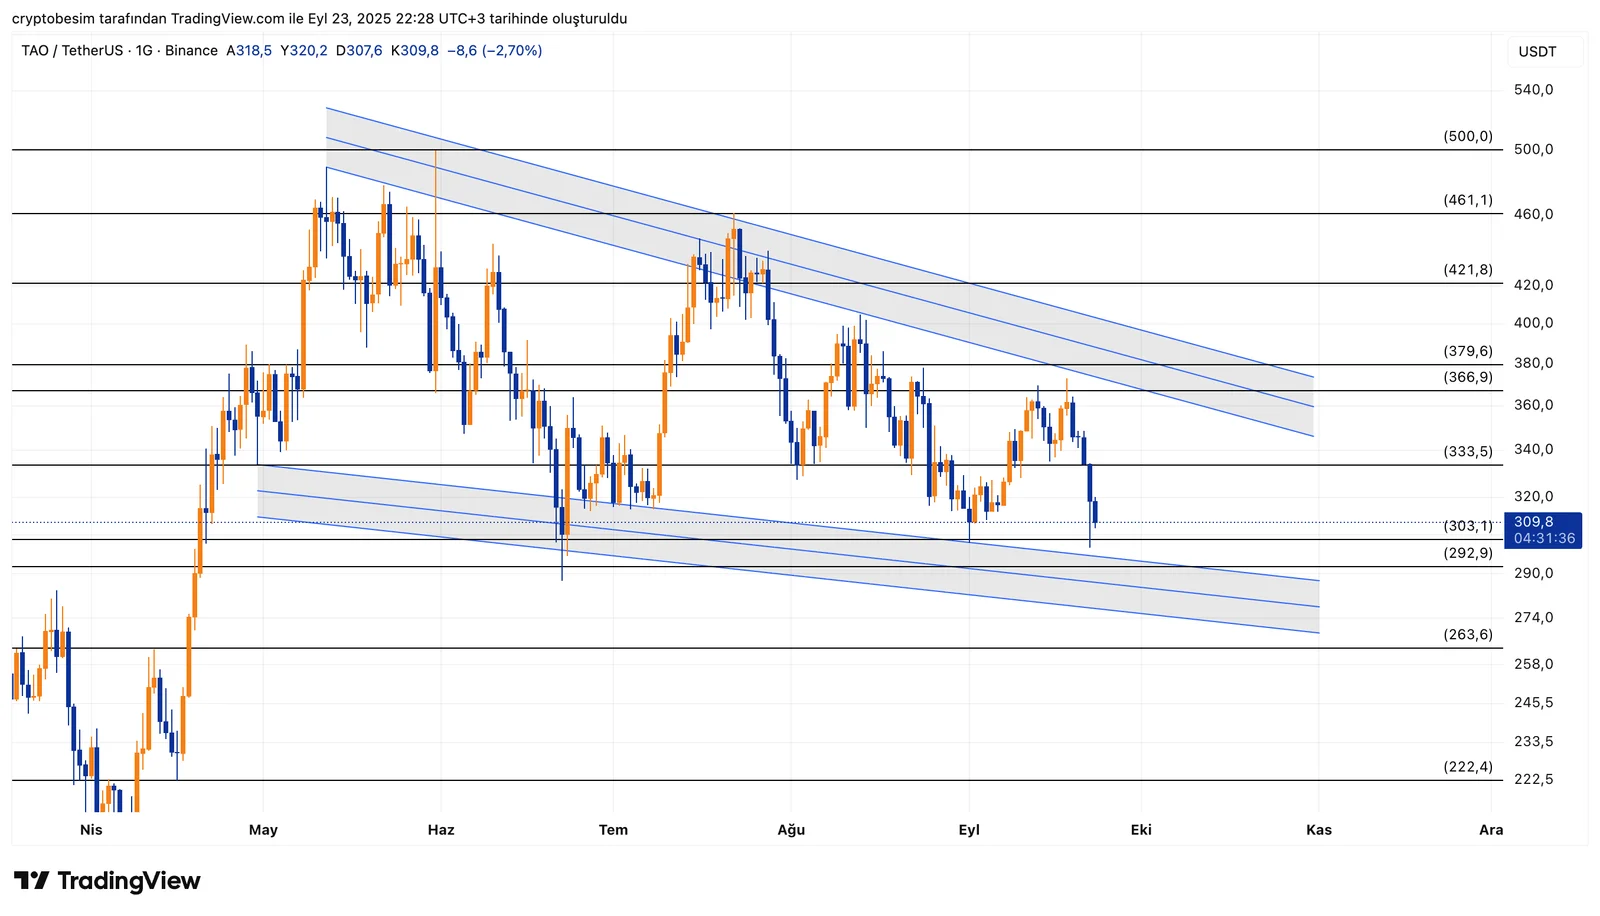
TAO is currently trading around the level $309, while the key support area stands between the levels $303–$292. The price holding above this area may pave the way for a bounce within the channel in the short term. The price is likely to test the resistance level $333 according to a bullish scenario. Above this resistance, TAO could surge to the levels $366–$379, yet the price needs to break above $400 to confirm a trend reversal. If it does so, we will be talking about the levels $421, $461, and $500.
The price is likely to pull back to the lower border of the channel if it sees closing below the level $292, according to a bearish scenario. If this happens, we should be following the support levels at $263 and $222.
Support Levels:
- $303–$292 (key short-term support)
- $263
- $222
Resistance Levels:
- $333
- $366–$379
- $400
- $421 → $461 → $500
Summary:TAO is still trading inside a descending channel. Holding above $292 is important for a recovery, while a close above $400 would signal a stronger trend reversal in the medium term.
These analyses, not offering any kind of investment advice, focus on support and resistance levels considered to offer trading opportunities in the short and medium term according to the market conditions. However, traders are responsible for their own actions and risk management. Moreover, it is highly recommended to use stop loss (SL) during trades.


