
SUI Technical Analysis
Sui returned to the spotlight at the beginning of 2026 with spot ETF developments. 21Shares’ spot SUI ETF, which began trading on Nasdaq, made direct access easier for institutional investors. At the same time, the launch of staking-focused ETF products shows that Sui has become more visible on the investment side. Despite this positive news flow, price action remains volatile and under pressure. For that reason, it is important to evaluate how much of the ETF-driven interest is actually reflected in the chart.
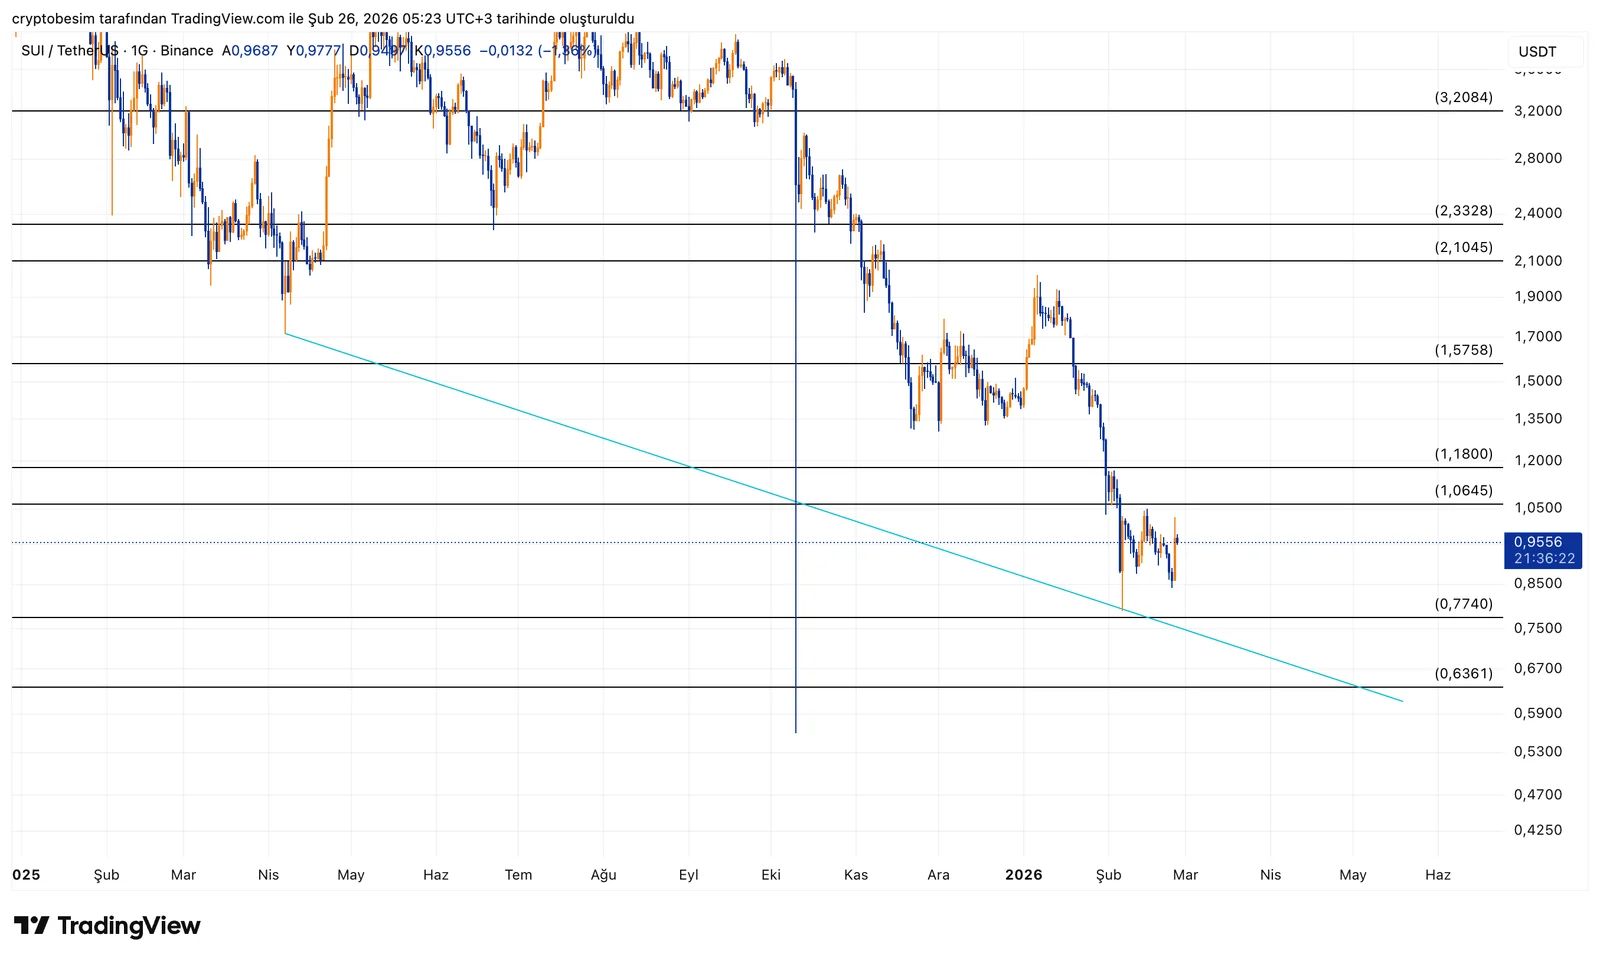
On the technical side, the primary structure remains clearly negative. On the daily chart, the lower high – lower low sequence continues, and price is still trading below the main descending trend.
The critical threshold is 1.06$.This level is important as both a horizontal resistance and the last breakdown area. As long as price remains below 1.06$, downside pressure persists and the 0.85$ – 0.77$ band comes back into focus. If this zone is lost, 0.63$ emerges as the next major support.
In the upside scenario:Sustained price action above 1.06$ would weaken the current bearish structure. In that case, 1.18$ becomes the first level to watch, followed by a potential recovery toward the 1.40$ – 1.50$ band. Especially daily closes above 1.40$ would signal strengthening in the medium-term structure.
- Summary:Below 1.06$ → bearish structure continuesAbove 1.06$ → 1.40$ – 1.50$ potentialThe main trend remains downward; a clear breakout is required for a structural shift
These analyses do not provide investment advice and focus on support and resistance levels that are considered to offer short- and medium-term trading opportunities depending on market conditions. However, responsibility for execution and risk management lies entirely with the user. In addition, the use of stop loss is strongly recommended.


