SUI Technical Analysis
Sui is moving forward with major steps toward institutional adoption. Recent reports suggest that the network is working on a native stablecoin called “USDsui.” If launched, this could increase on-chain liquidity and make it easier for institutional players to join the ecosystem. Even though the broader crypto market has been quiet, real-world solutions like this help strengthen SUI’s long-term value proposition.
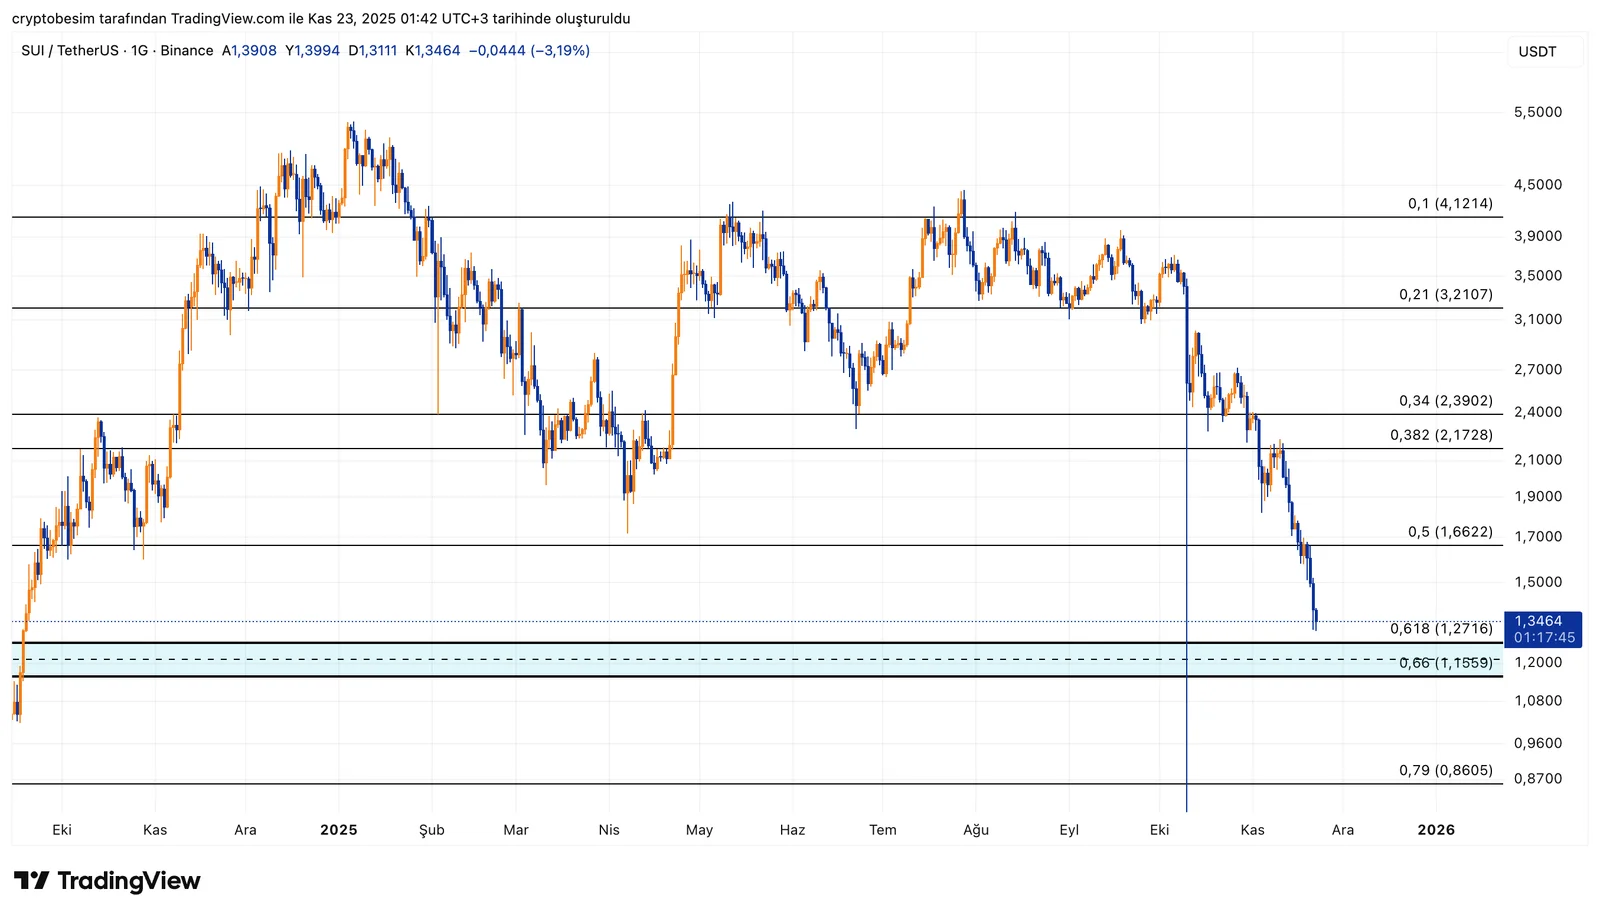
Analyzing the chart on the daily time frame, we see that the coin has pulled back exactly into the expected correction zone, the Fibonacci 0.618–0.66 band. This area often acts as a strong demand zone where trend-supporting reversals frequently occur. Right now, the price is trying to hold the upper side of this demand region between $1.27 and $1.55.
The meaning of this level is clear:
- $1.27 (0.618 Fib) is the first strong support.
- Holding above it gives SUI a solid base for a potential rebound.
Short-Term Bullish Scenario
As long as SUI stays above $1.27, the first recovery target is $1.66 (0.5 Fib).A clear move above that could open the way for a stronger rally toward the $2.17–$2.39 zone. Breaking the minor downtrend would accelerate this move.
Short-Term Bearish Scenario
If SUI closes below $1.27, the correction may deepen toward $1.15 (0.66 Fib).This is still a strong level that does not break the larger structure. Even in a worse pullback, the $0.79 region is the lowest major support before the broader pattern breaks.
Summary
SUI is currently sitting in the same kind of “golden ratio” support area we’ve recently seen in BTC and ETH. A single strong bullish candle from this zone could trigger a sharp short-term recovery.
These analyses, not offering any kind of investment advice, focus on support and resistance levels considered to offer trading opportunities in the short and medium term according to the market conditions. However,traders are responsible for their own actions and risk management. Morover, it is highly recommended to use stop loss (SL) during trades.


