
SUI Technical Outlook
On the SUI side, the falling wedge structure remains intact, and price has moved close to the upper boundary of the formation. The compression is increasing, which raises the probability of a breakout.
The 0.96 – 1.00 range is acting as short-term resistance. This area has worked multiple times before. If price manages to close above this level, the breakout of the formation starts to gain confirmation.
On the downside, the 0.86 – 0.84 range serves as both horizontal support and the lower trendline of the wedge. As long as this area holds, the structure is not considered broken.
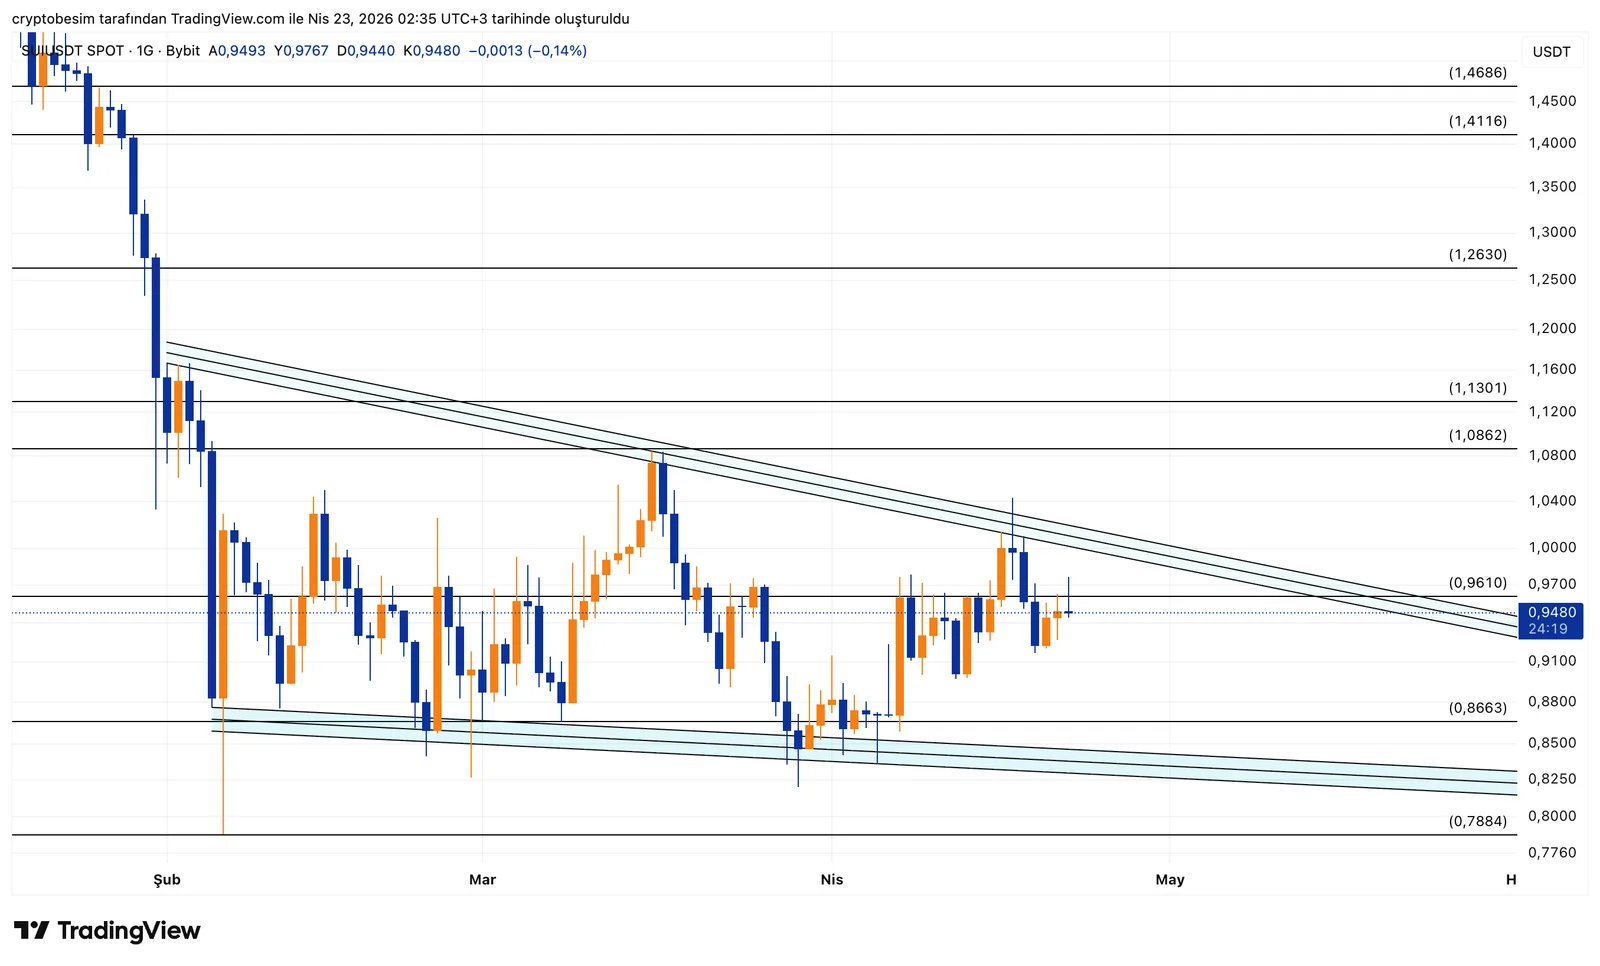
Upside scenario:
- Holding above 1.00 → breakout signal
- 1.13 as the first target
- 1.41 as the main target
Downside scenario:
- A close below 0.84 → structure weakens
- Downward pressure increases toward the lower band
Overall, price is still trading below resistance, but structurally, the probability of an upward breakout remains slightly ahead.
These analyses do not provide investment advice and focus on support and resistance levels that are considered to offer short- and medium-term trading opportunities depending on market conditions. However, responsibility for execution and risk management lies entirely with the user. In addition, the use of stop loss is strongly recommended.


