SOL Technical Analysis
On the SOL side, the most notable recent development has been its inclusion in institutional investment products. A new ETF traded on Nasdaq by GSR now includes Solana alongside Bitcoin and Ethereum. Moreover, this product focuses not only on price movement but also on staking yield. This detail shows that Solana is starting to be considered within larger portfolios. The key factor will be whether this institutional interest creates a lasting impact on price.
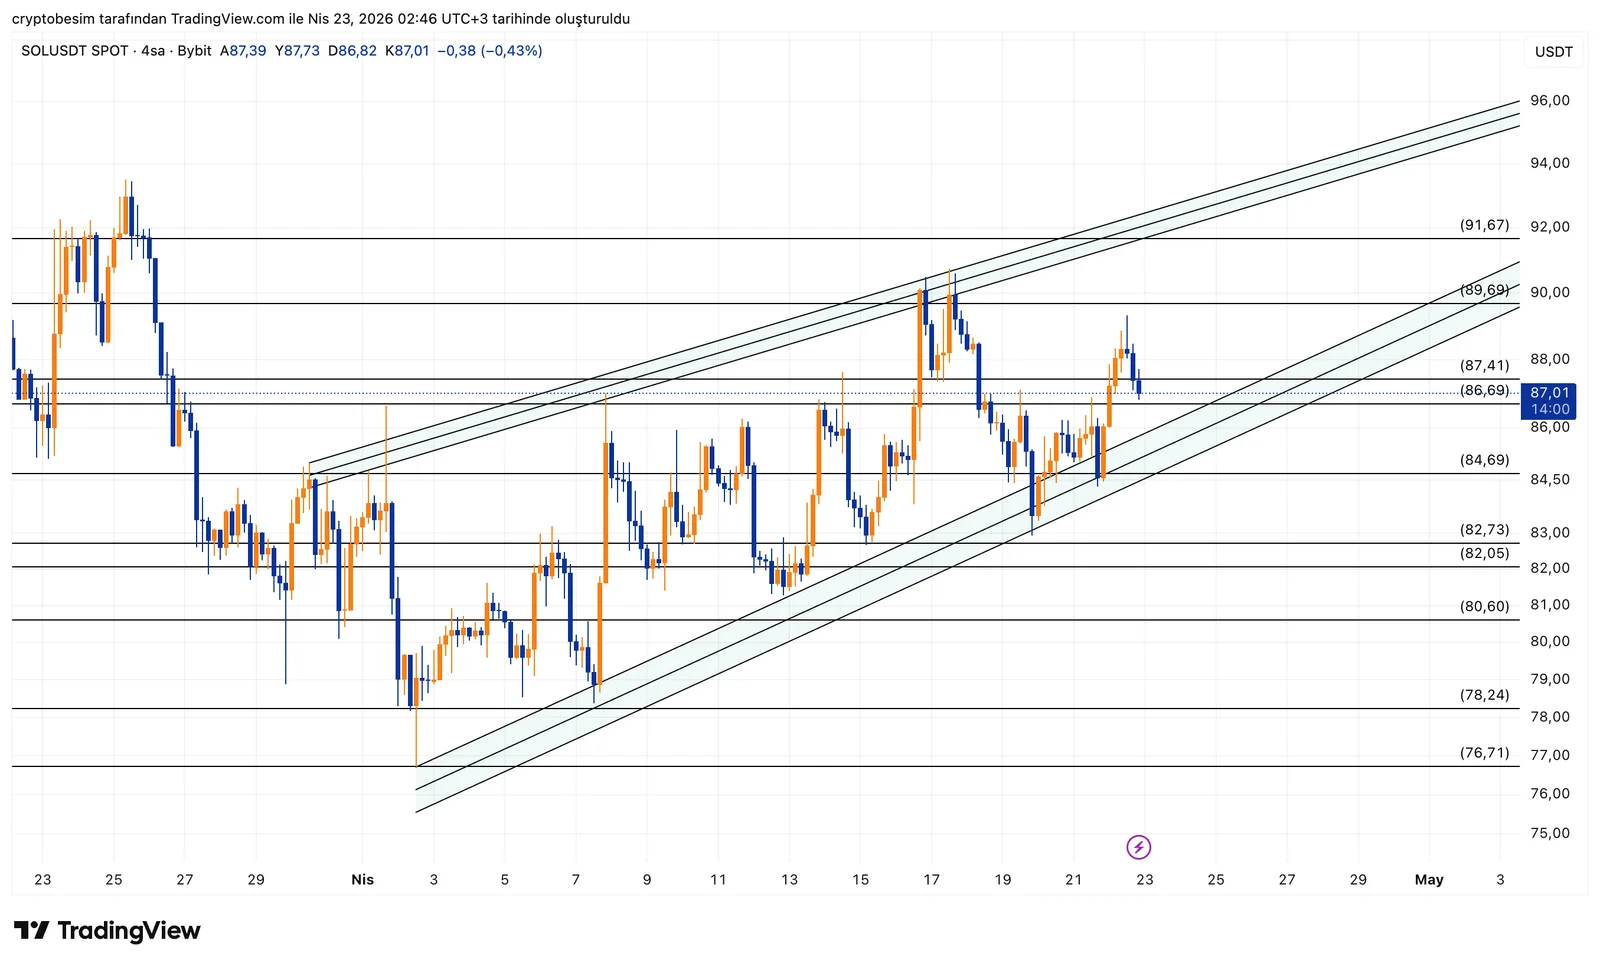
From a technical perspective, the structure is upward. Price continues to move within a rising channel and is currently near the mid-band.
The 86.5 – 87 range is acting as a short-term resistance. If price breaks above and holds, we may see a move toward the upper band of the channel. In that case, the 89.5 – 91.5 zone becomes the natural target.
On the downside, the 84.5 – 82.7 range serves as support. This area is also close to the lower boundary of the channel. As long as this zone holds, the rising structure remains intact and pullbacks can be considered normal.
If price drops below 82, the channel structure weakens and a gap opens toward the 80 – 78 range.
In summary:
- Rising channel is intact
- Above 87 → targets 89.5 and 91.5
- 84.5 – 82.7 is the support zone
- Below 82 → structure weakens
- Further downside → 80 – 78 range becomes relevant
The current structure is upward, but for a clear move, price either needs to break toward the upper band or test the lower support.
These analyses do not provide investment advice and focus on support and resistance levels that are considered to offer short- and medium-term trading opportunities depending on market conditions. However, responsibility for execution and risk management lies entirely with the user. In addition, the use of stop loss is strongly recommended.