SOL Technical Analysis
Solana started the new year strong. Whales have continued to accumulate SOL since the beginning of the year, indicating that there is still strong confidence in the market. As transaction volume and the number of users on the network increase, Solana’s steps in areas such as DeFi and prediction markets stand out. As usage grows, network activity remains vibrant. All these developments may support potential moves on the technical side.
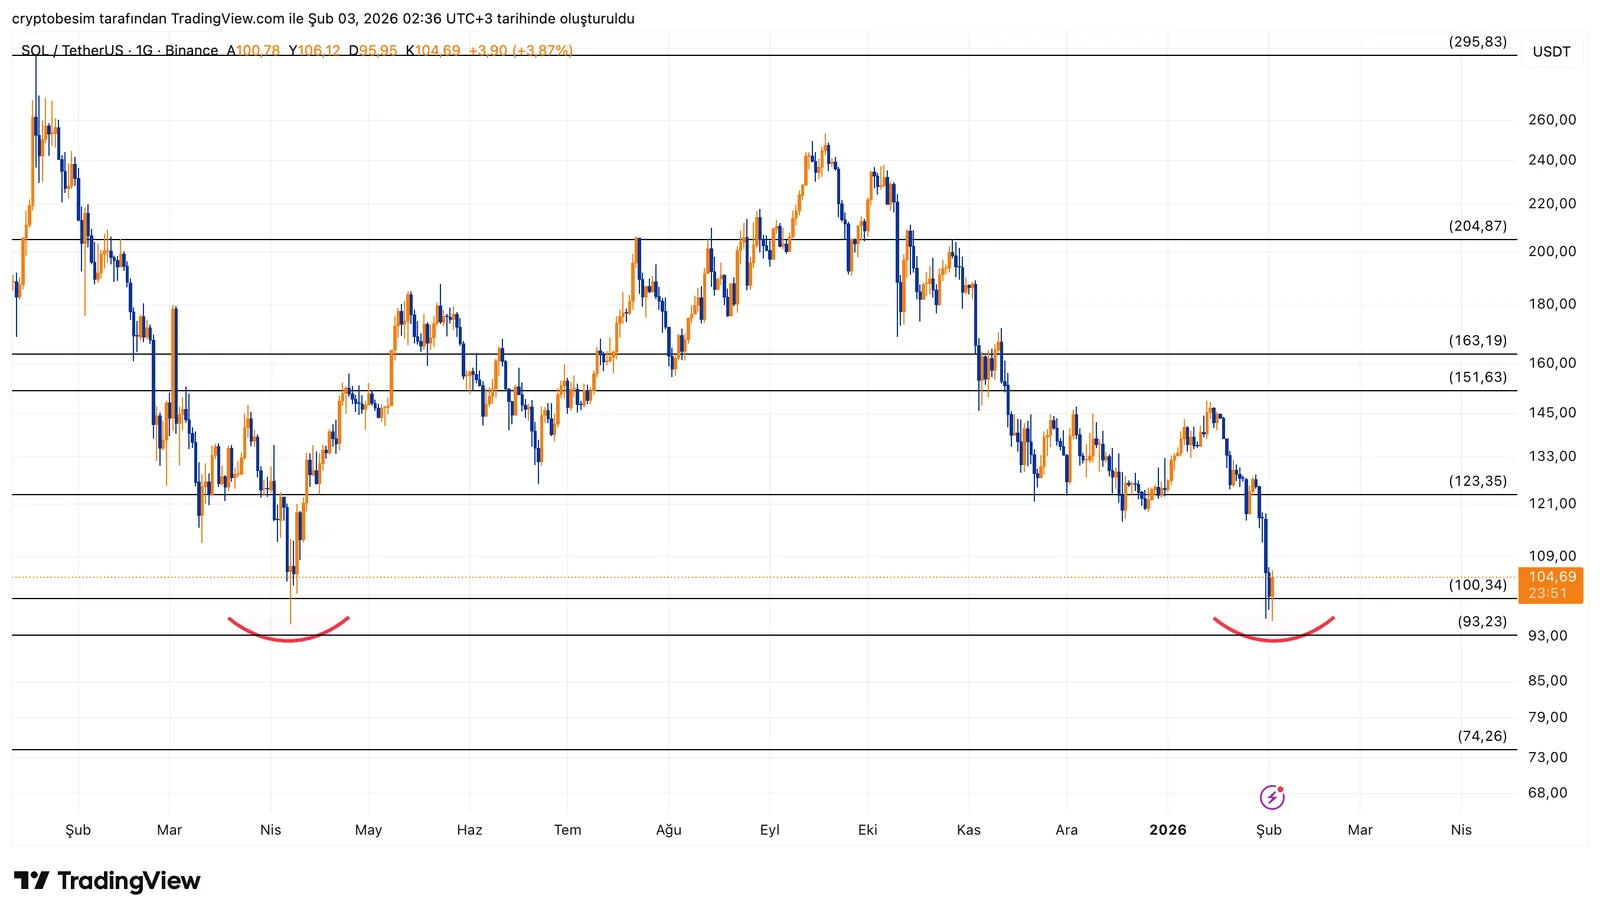
On the SOL daily chart, a clear double bottom structure stands out. The 93 – 100 band, which previously produced a strong reaction, has worked once again. The same region also perfectly overlaps with the Fibonacci retracement area where a reaction is expected, making the bounce technically meaningful.
For this structure to remain valid, the 100 – 104 region is critical. As long as the price stays above this band, the probability of continuation of the reaction remains higher. In this scenario, 123 stands out as the first target. Subsequently, the 151 – 163 band is followed as the main target zone.
On the downside risk side, closes below 93 break this double bottom structure. In such a scenario, selling pressure deepens and the 74 region comes back into focus.
- In summary;Above 100 – 104 → double bottom holds, reaction continuesTargets: 123 → 151 / 163Below 93 → structure breaks, risk increases
These analyses, which do not provide investment advice, focus on support and resistance levels that are thought to create short- and medium-term trading opportunities depending on market conditions. However, the responsibility for trading and risk management belongs entirely to the user. In addition, it is strongly recommended to use stop loss for the positions shared.


