
SHIB/USDT Technical Outlook
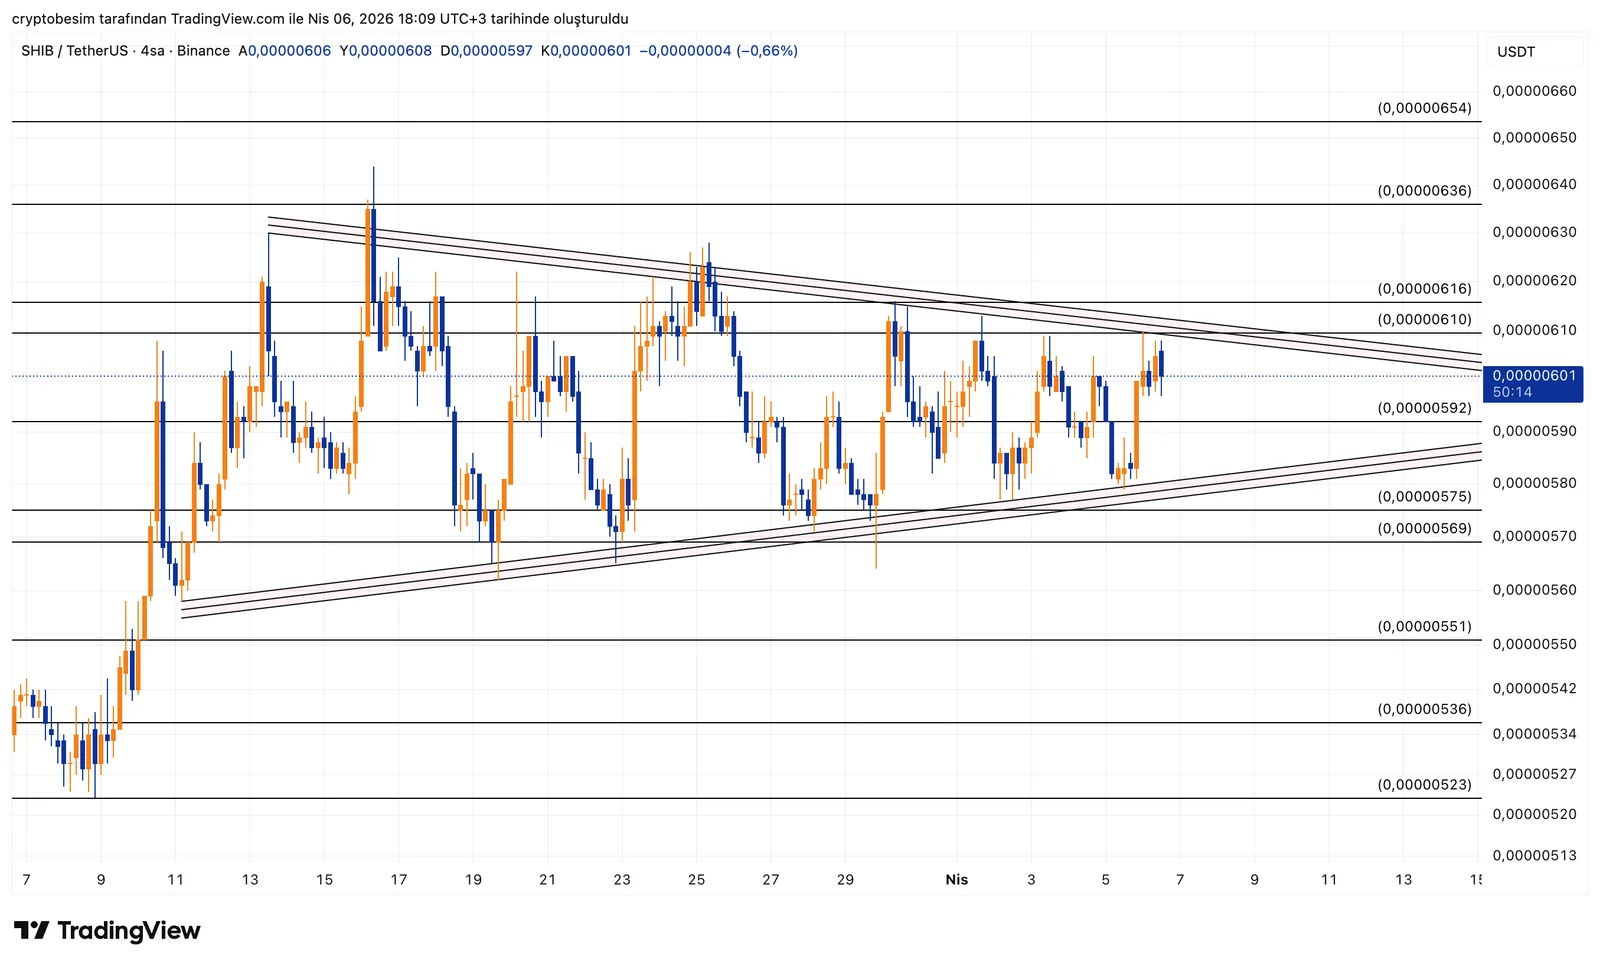
Currently, price is near the middle of the triangle. This means the market is at a decision point. It is not moving clearly up or down, but this compression will not last long. Once the breakout comes, volatility increases significantly.
On the upside, the 0.00000610–0.00000616 range represents the upper resistance of the triangle. If this area is broken, price can move quickly toward 0.00000636 and 0.00000654, as the space above is relatively open.
On the downside, the 0.00000575–0.00000569 range acts as the lower support. If this zone is lost, price may decline toward 0.00000551 and then 0.00000536.
In summary, the structure is compressed and a breakout is very close. Regardless of direction, the move is likely to be sharp.
- The structure is near a breakout within a symmetrical triangle formation
- A break above 0.00000610–0.00000616 accelerates upward movement
- Upside targets are 0.00000636 and 0.00000654
- A break below 0.00000575–0.00000569 increases selling pressure
- Downside supports are 0.00000551 and 0.00000536
These analyses do not provide investment advice and focus on support and resistance levels that are considered to offer short- and medium-term trading opportunities depending on market conditions. However, responsibility for execution and risk management lies entirely with the user. In addition, the use of stop loss is strongly recommended.


