
PEPE/USDT Technical Analysis
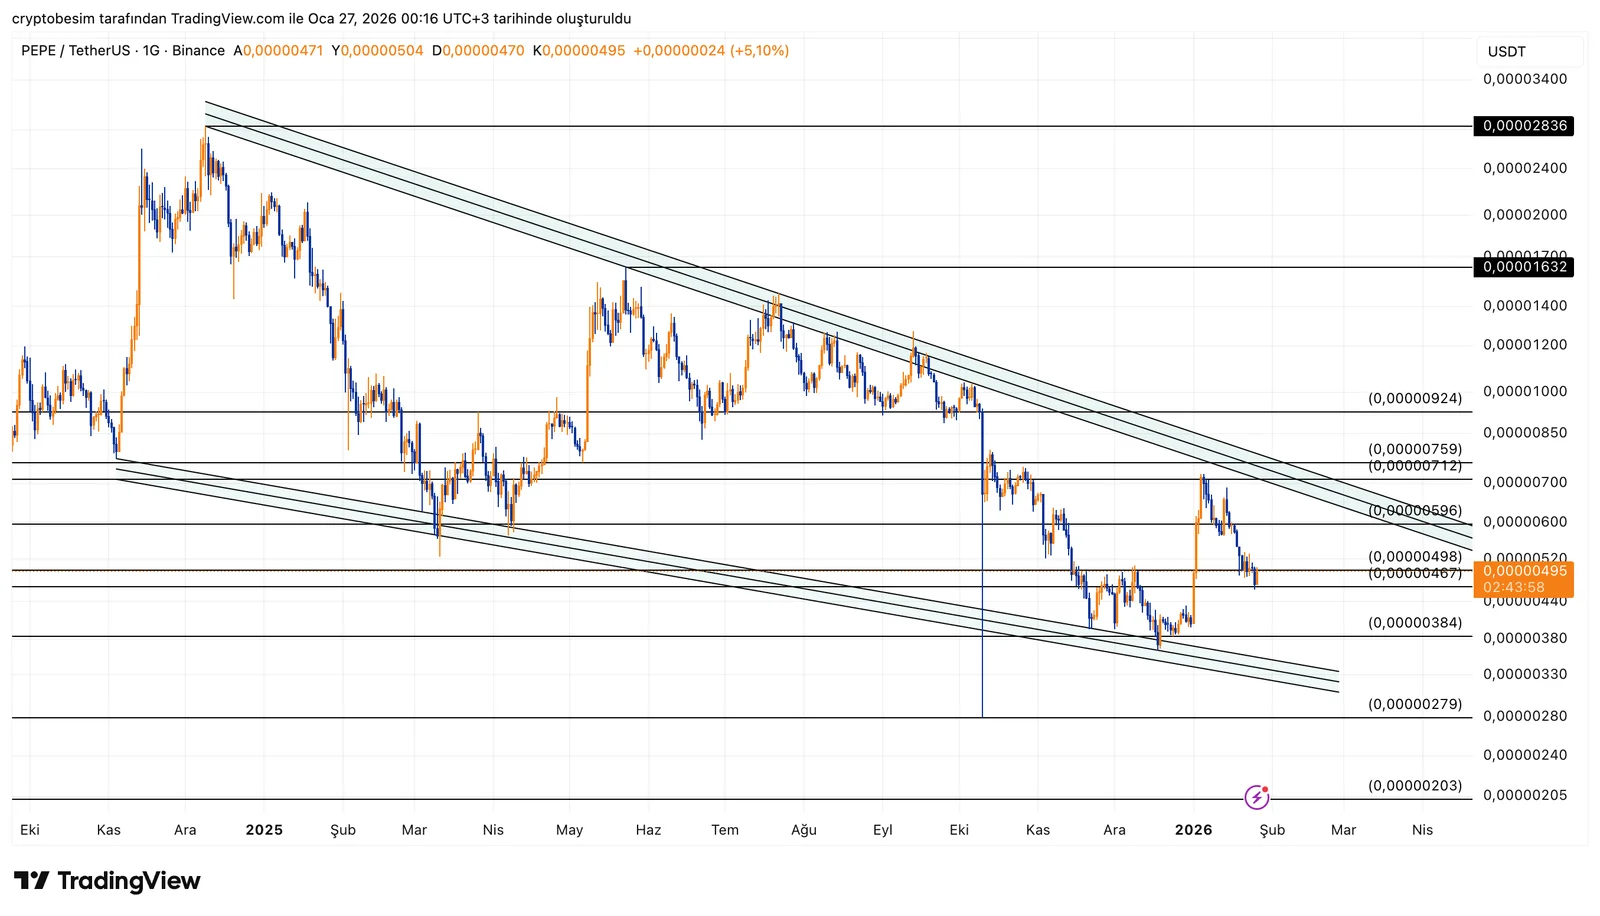
Analyzing the chart, we see that PEPE is currently forming a falling wedge pattern, which often appears near potential trend changes. The current price is around $0.00000495, and price is trying to hold above the $0.00000467 – $0.00000498 zone. This area is a make-or-break level in the short term.
Bullish Scenario
The upper resistance line of the wedge is located around $0.00000596. If price can break above this level and holds:
- First targets: $0.00000712 – $0.00000759
- If this zone is cleared, the next major resistance is $0.00000924
- In a broader upside scenario, strong resistance levels are found at $0.00001632 and $0.00002836
Bearish Scenario
If price drops below $0.00000467 and fails to recover:
- First support to watch: $0.00000384
- If this level breaks, price may slide toward the lower wedge boundary
- Next support levels: $0.00000279, then $0.00000203
Summary :
As long as the $0.00000467 – $0.00000498 zone holds, focus remains on a potential breakout above $0.00000596. If no breakout occurs, the risk of price being pushed back down from this range remains on the table.
These analyses, not offering any kind of investment advice, focus on support and resistance levels considered to offer trading opportunities in the short and medium term according to the market conditions. However,traders are responsible for their own actions and risk management. Morover, it is highly recommended to use stop loss (SL) during trades.


