
OP/USDT Technical Analysis
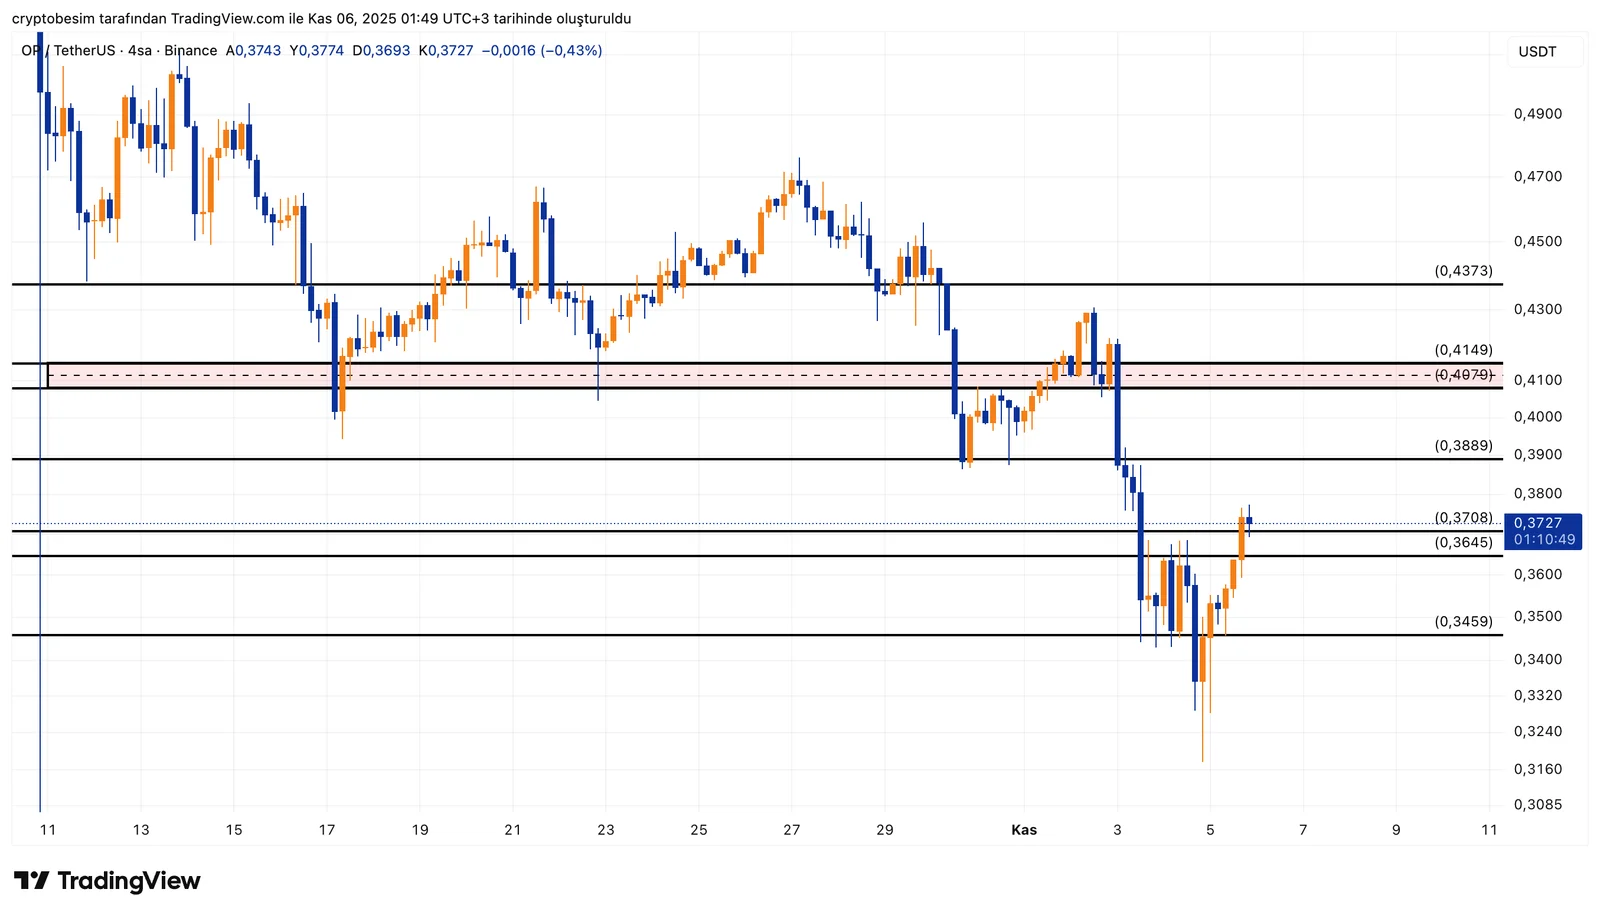
Analyzing the chart on the 4-hour time frame, we see that OP is moving in accordance with Fibonacci retracement levels. After the sharp drop, the price bounced strongly from the 0.3459 support level, triggering a short-term uptrend.The price is currently trading around the 0.37 zone, which coincides with the Fibonacci 0.382 retracement level — a short-term resistance. A breakout above this level could extend the upward move toward the 0.40–0.42 range. However, this region represents a historically strong resistance area, aligning with the Fibonacci 0.618 level, where notable selling pressure has previously emerged.We need to see daily closes above the 0.414–0.420 band for the bullish momentum to continue. Otherwise, renewed selling pressure may arise from this zone, leading to a potential pullback toward the 0.3645 support level.
- Support and Resistance LevelsSupports: 0.3645 – 0.3459 – 0.3240Resistances: 0.3889 – 0.4079 – 0.4149 – 0.4373
These analyses, not offering any kind of investment advice, focus on support and resistance levels considered to offer trading opportunities in the short and medium term according to the market conditions. However, traders are responsible for their own actions and risk management. Moreover, it is highly recommended to use stop loss (SL) during trades.


