
ONDO Technical Outlook
There is a clear symmetrical triangle pattern on the chart. The price is stuck between lower highs and higher lows, thus creating a consolidation zone. Such patterns often end up with sharp and high-volume moves in the direction of the breakout.ONDO is currently trading around the level at $0.91 and trying to move upward following the bounce from the lower trendline of the triangle formation. We have the $0.95 as the short-term resistance level. Above it, the range between the levels $1.02 and $1.05 will be the main decision area which overlaps with the upper border of the triangle. If broken, ONDO is expected to climb to the level $1.12 and then to $1.20. Moreover, the technical main target of the formation is $1.35.According to a bearish scenario, ONDO could go down to the first support at $0.87. If this support gets broken down, the price could test $0.81 → $0.74. In such a case, the formation becomes invalid.
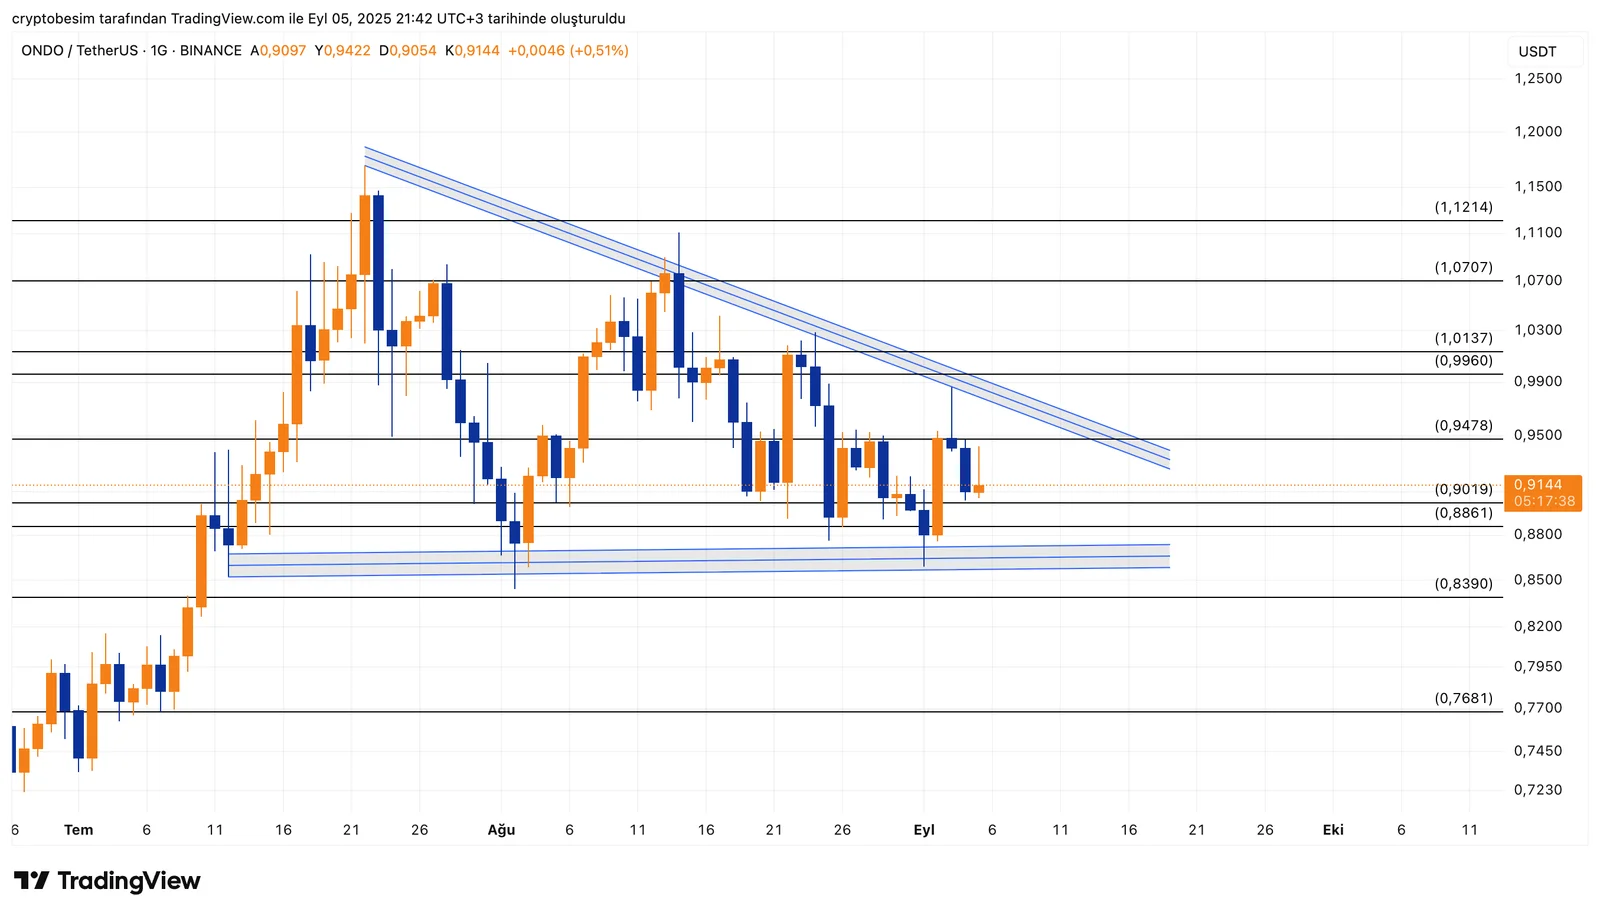
Summary:
- Key support: $0.87 (risk down to $0.81 → $0.74)
- First resistance level: $0.95
- Decision zone: $1.02 – $1.05
- Breakout targets up: $1.12 → $1.20 → $1.35
These analyses, not offering any kind of investment advice, focus on support and resistance levels considered to offer trading opportunities in the short and medium term according to the market conditions. However, the user is responsible for their own actions and risk management. Moreover, it is highly recommended to use stop loss (SL) during the transactions.


