
OKB/USDT Technical Analysis
On the OKB side, as of March 2026, the focus has been on exchange ecosystem developments and platform-related updates. New product launches and campaigns on the OKX side continue to support the token’s utility. In particular, platform-based benefits and usage incentives are keeping interest in OKB alive. However, despite this, there is still no clear direction in price action. Therefore, it is important to observe how this exchange-driven activity is reflected in the technical chart.
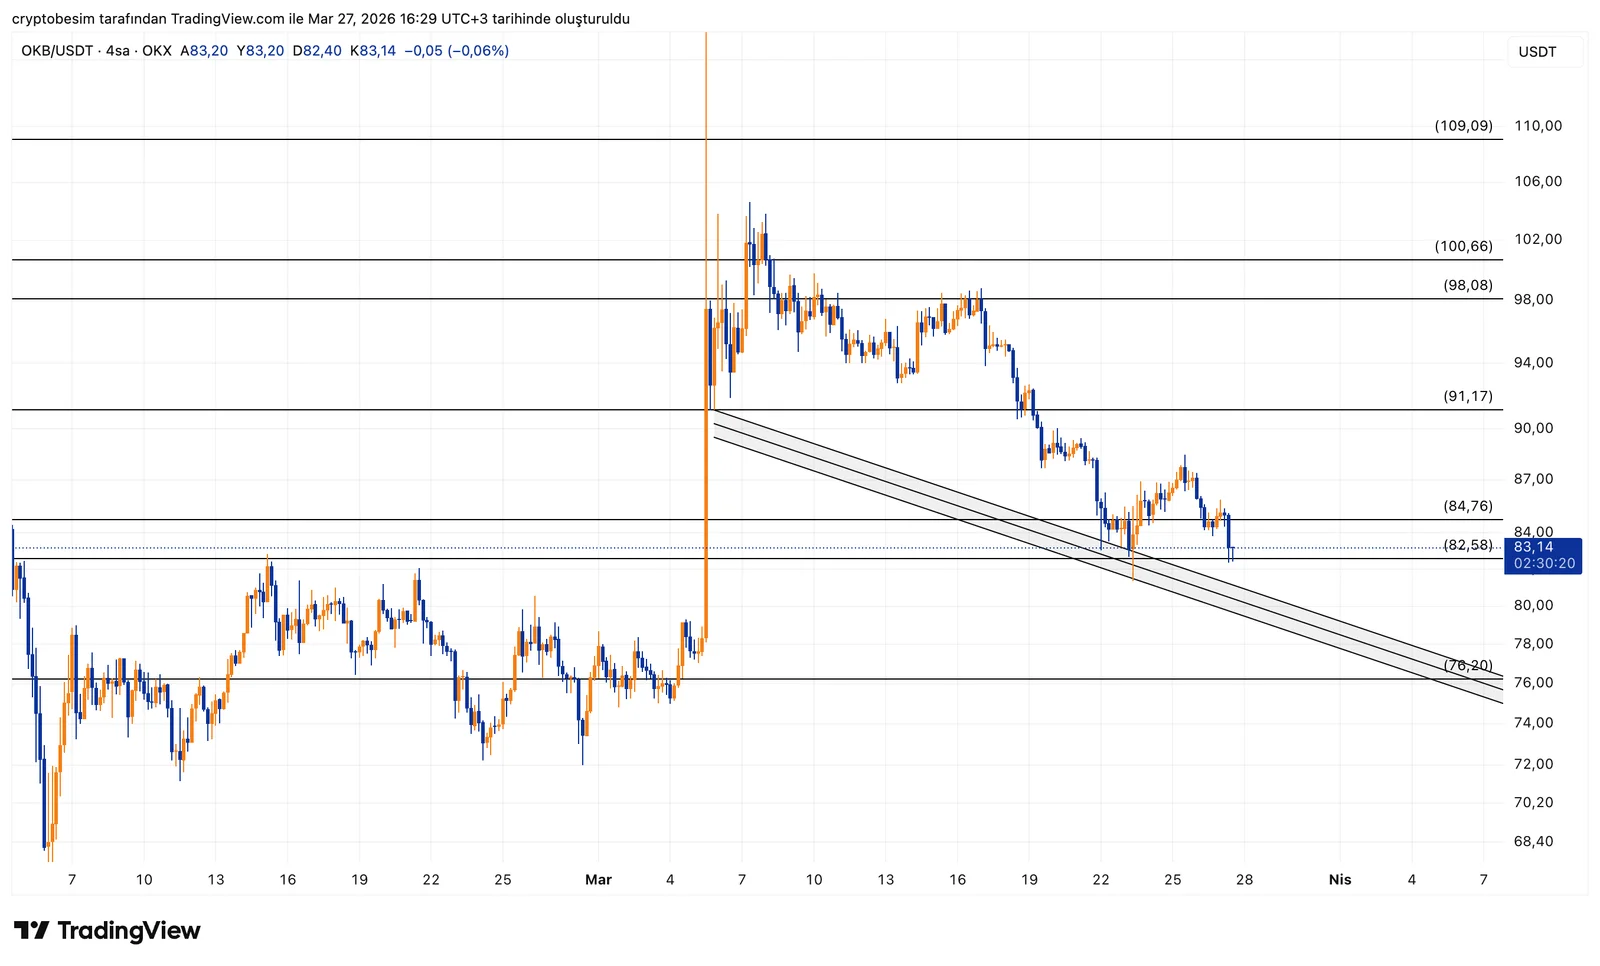
On the chart, the area where price settled after the drop corresponds to an important zone. Around 82 dollars is both a previously tested level and aligns with the 0.618 Fibonacci level. For this reason, it is normal for buyers to step in here.
Currently, price is trying to hold just above this region. We have also seen price touch this level and react before. So in the short term, this area is acting as a base.
However, if price drops below this level, the situation changes. There is a descending trendline just below. If that is also broken, there is not much support left below, and price could pull back more sharply toward the 76 dollar region.
On the upside, in a first recovery move, attention shifts back to the 100 dollar level. There is an intermediate 84–90 range, but the main resistance remains around 100 dollars.
- As long as price stays above 82 dollars, recovery attempts continue
- Below 82 dollars, selling pressure increases
- If the trendline breaks, space opens toward 76 dollars
- On the upside, the first major target is the 100 dollar level
These analyses do not provide investment advice and focus on support and resistance levels that are considered to offer short- and medium-term trading opportunities depending on market conditions. However, responsibility for execution and risk management lies entirely with the user. In addition, the use of stop loss is strongly recommended.


