
OKB/USDT Technical Analysis
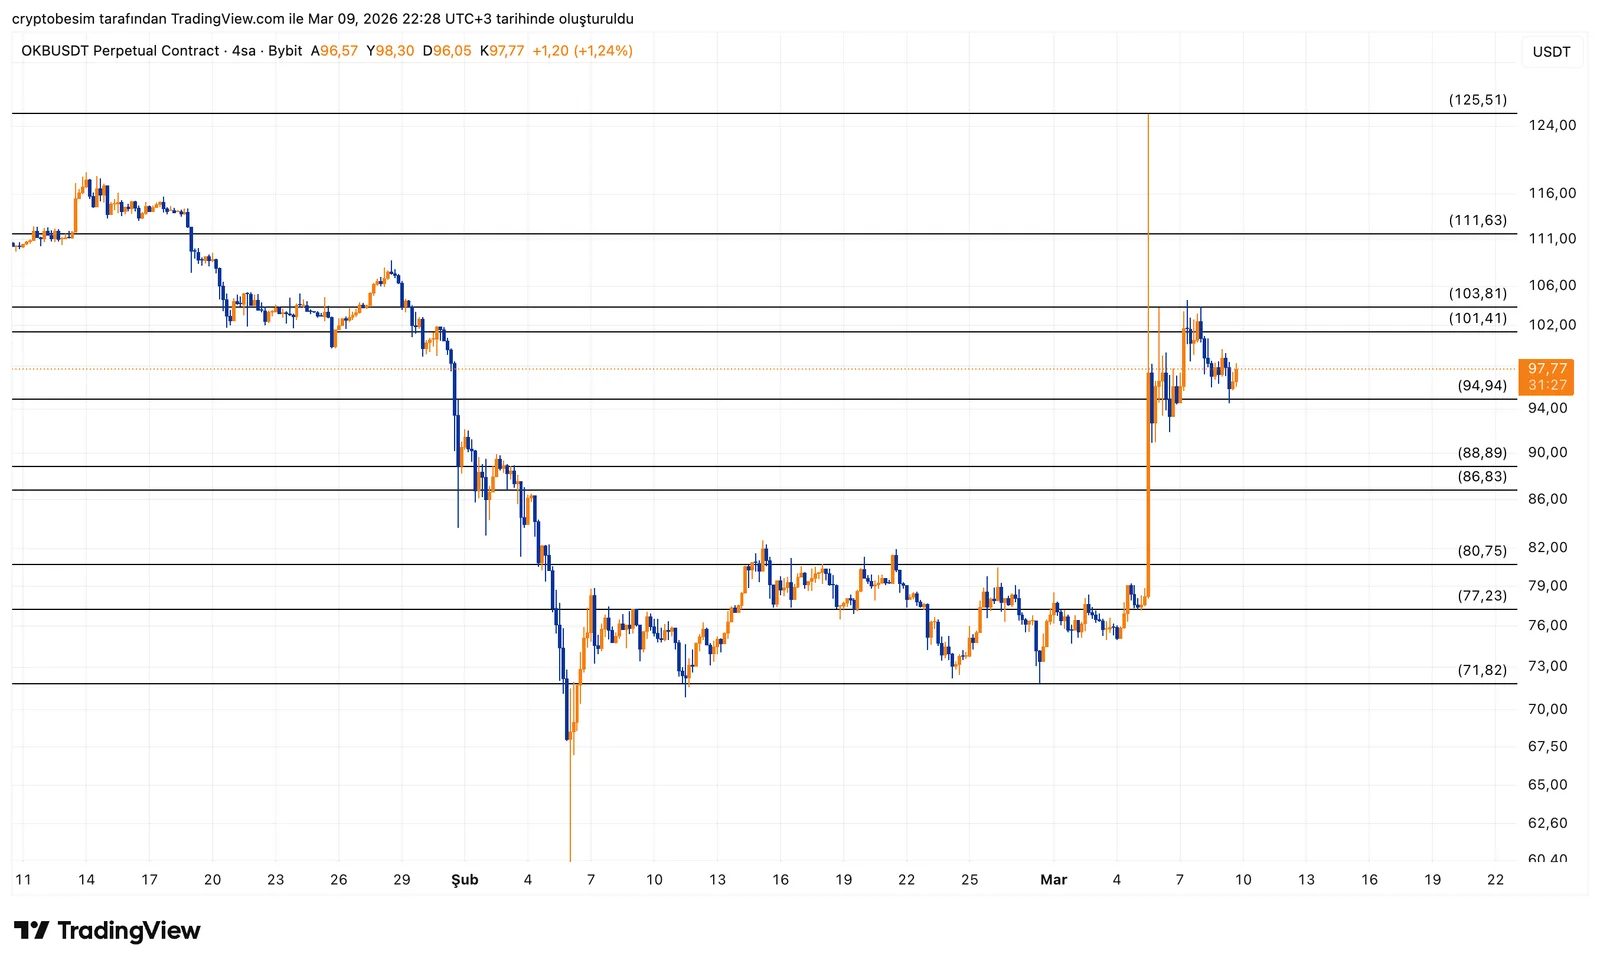
The first thing that stands out on the OKB chart is a sharp breakout move. After trading sideways around 70–80 dollars for a long time, the price suddenly surged upward with a strong candle. Moves like this usually occur either due to strong news flow or after liquidity has been cleared. What followed that jump is the market calming down and trying to establish a new balance.
Price is currently hovering around 95 dollars. This area is acting as a short-term support zone. Just above it lies the 101–103 dollar range. After the latest rally, price touched this zone and then pulled back. This means that, in the short term, this level is the first wall buyers need to break.
If price turns upward again and manages to establish acceptance above 103 dollars, the market may attempt to test the next zone. The next key level there is 111 dollars. Further above, the last major level visible on the chart sits around 125 dollars.
On the downside, the structure is simpler. If the 94–95 dollar area is lost, price could weaken toward the 88–89 dollar range. Below that region, the previous consolidation zone around 80 dollars comes back into focus.
The current picture can be interpreted like this: after a sharp rally, the market is taking a breather. Unless the 101–103 dollar band is broken, price may continue to move sideways around this area for a while. If this level is surpassed, the gap above could fill quickly.
These analyses do not provide investment advice and focus on support and resistance levels that are considered to offer short- and medium-term trading opportunities depending on market conditions. However, responsibility for execution and risk management lies entirely with the user. In addition, the use of stop loss is strongly recommended.


