
MAV/USDT Technical Analysis
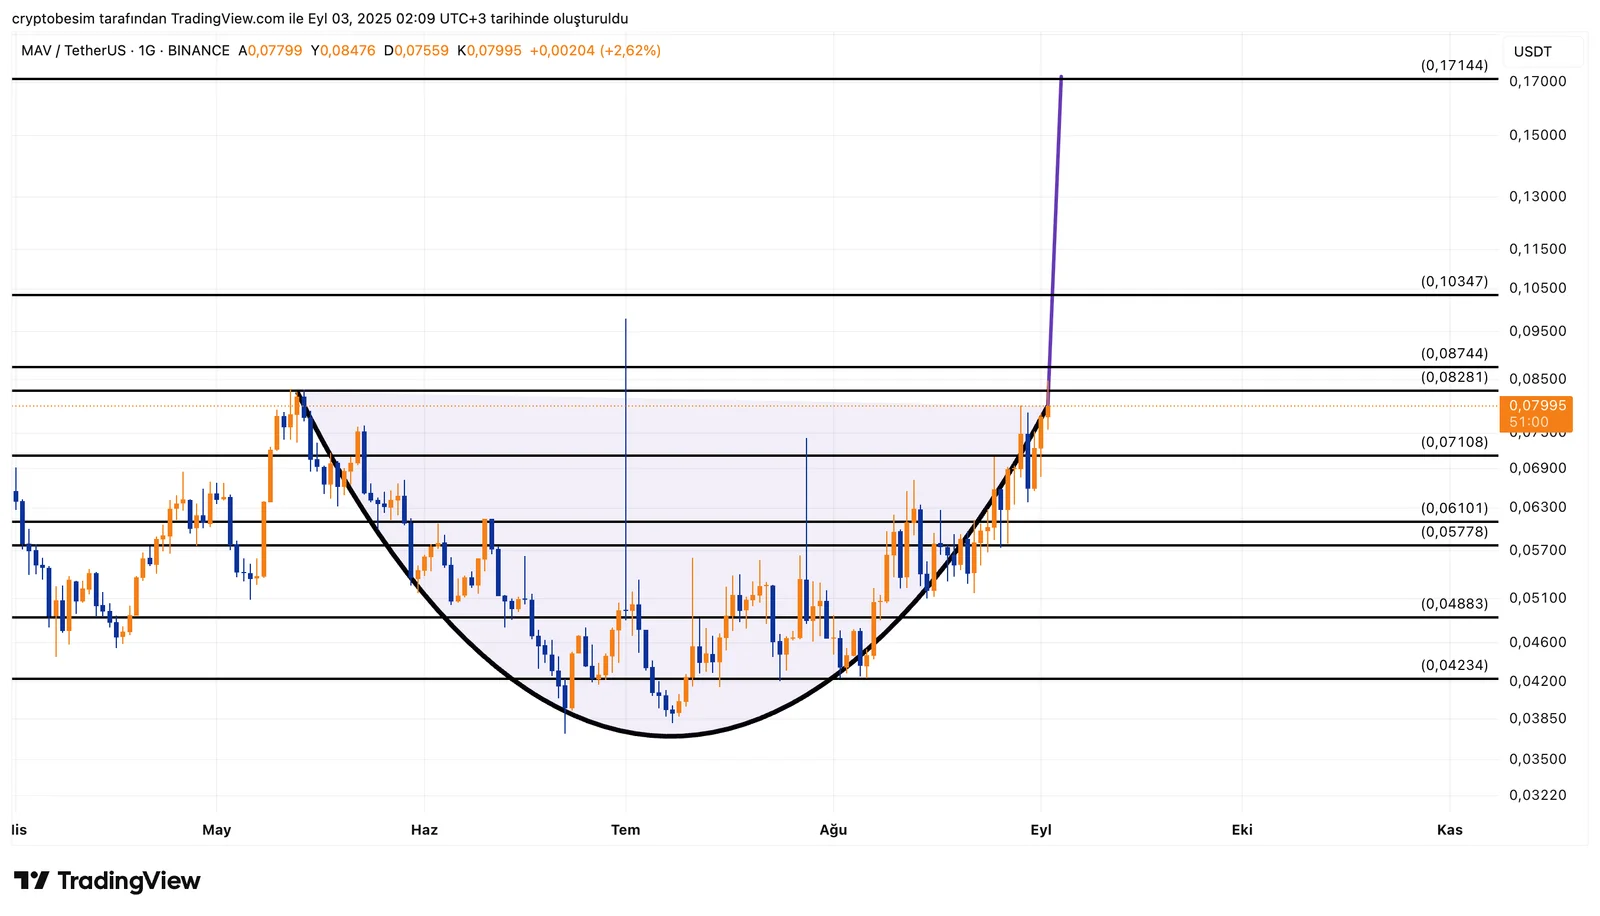
Analyzing the MAV chart, we see a clear cup pattern formation, the target of which points to the marked resistance area on the chart. MAV has strong potential to rise toward this target if a breakout occurs from here.After completing the cup, the price could make a short pullback to form a handle according to another possible scenario. In this case, the pattern would turn into a cup-and-handle, which often leads to even stronger bullish momentum after the breakout.In summary, the breakout zone should be watched closely. If an upside confirmation happens, a strong move toward the target can be expected.
These analyses, not offering any kind of investment advice, focus on support and resistance levels considered to offer trading opportunities in the short and medium term according to the market conditions. However, the user is responsible for their own actions and risk management. Moreover, it is highly recommended to use stop loss (SL) during the trades.


