
INJ/USDT Technical Outlook
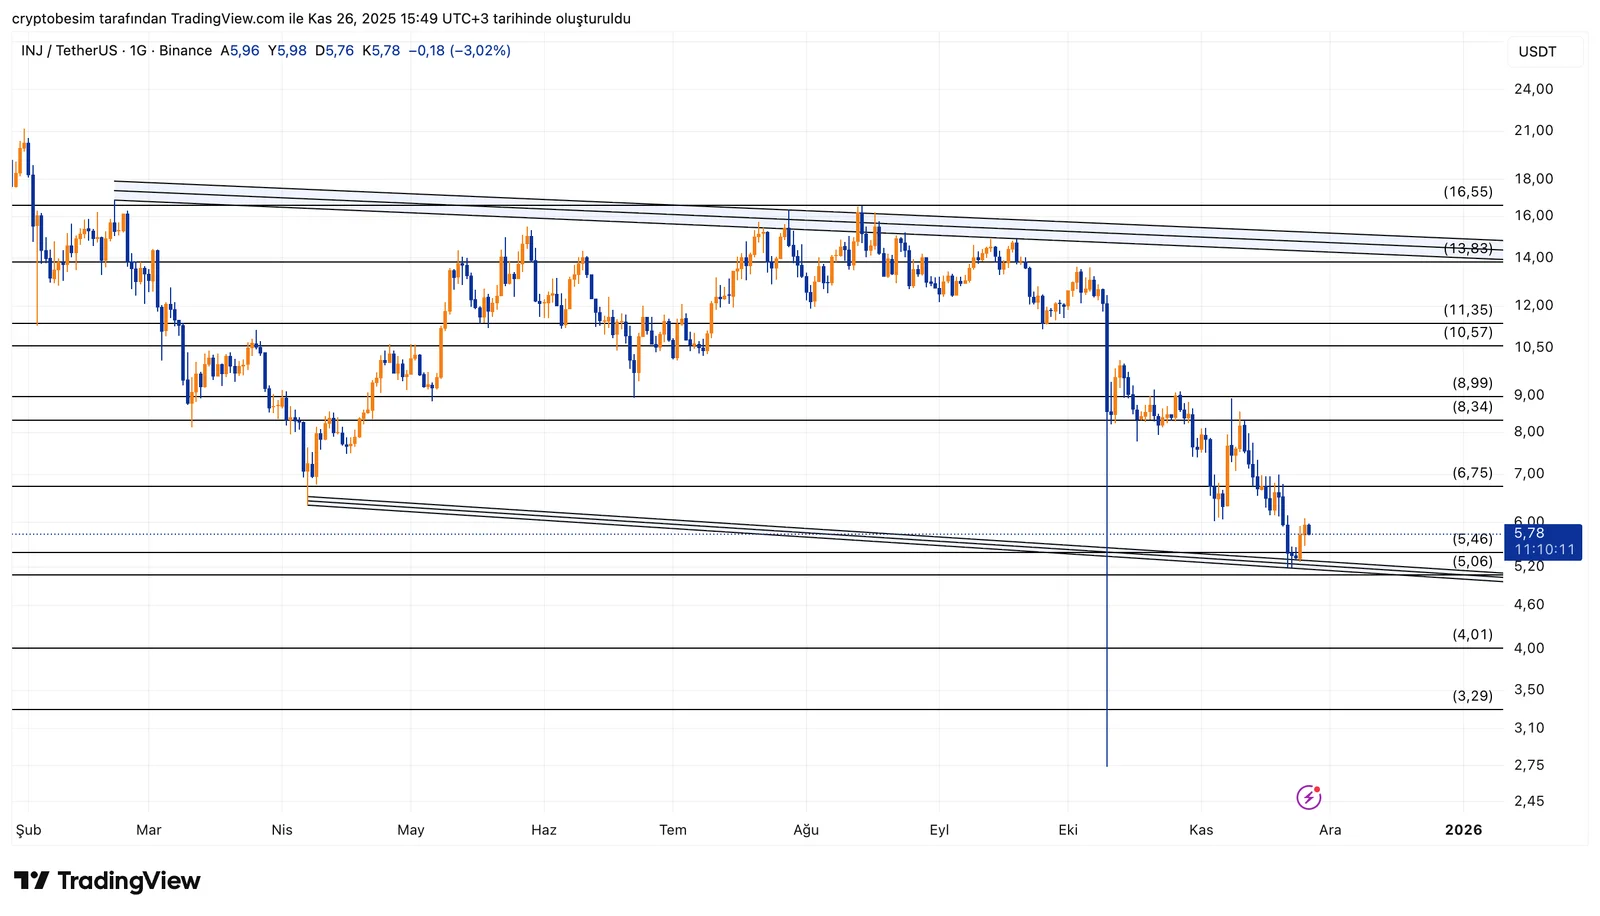
Analyzing the chart, we can see that there are two patterns working at the same time: a wide horizontal range and a descending trend channel that is pushing the price downward. For a long time, the price has been moving inside the $5.06 – $6.75 range, and it is currently trading near the lower part of this zone. This setup brings both risk and opportunity, because every time the price has tested the lower band, buyers have stepped in.
Looking at the trend structure, INJ has also touched the lower band of the descending channel. This support zone sits around $5.20 – $5.40, and the price is currently attempting to bounce from there. The small recovery coming from the channel bottom suggests that sellers are losing momentum and a short-term relief move is possible.
The first short-term target to watch is the horizontal resistance at $5.46 – $5.80. If INJ can break above this area, the price will move toward the middle of the horizontal range and start heading toward the mid-line of the descending channel. This mid-line aligns with the $6.75 level — a strong resistance zone from both the range and the trend perspective.
However, the $5.20 – $5.06 zone is critical below. If this support breaks, the price could drop into a wider empty zone down toward $4.60 – $4.01. For now, however, the chart shows that this support area is holding, and the probability of a short-term bounce is slightly stronger.
These analyses, not offering any kind of investment advice, focus on support and resistance levels considered to offer trading opportunities in the short and medium term according to the market conditions. However, traders are responsible for their own actions and risk management. Morover, it is highly recommended to use stop loss (SL) during trades.


