
ID Technical Outlook
According to the chart, we can say that ID has still been trading inside a falling channel structure for a long time; the price has recently approached the upper border of the channel again. Reactions from the level signal a higher probability of a breakout.
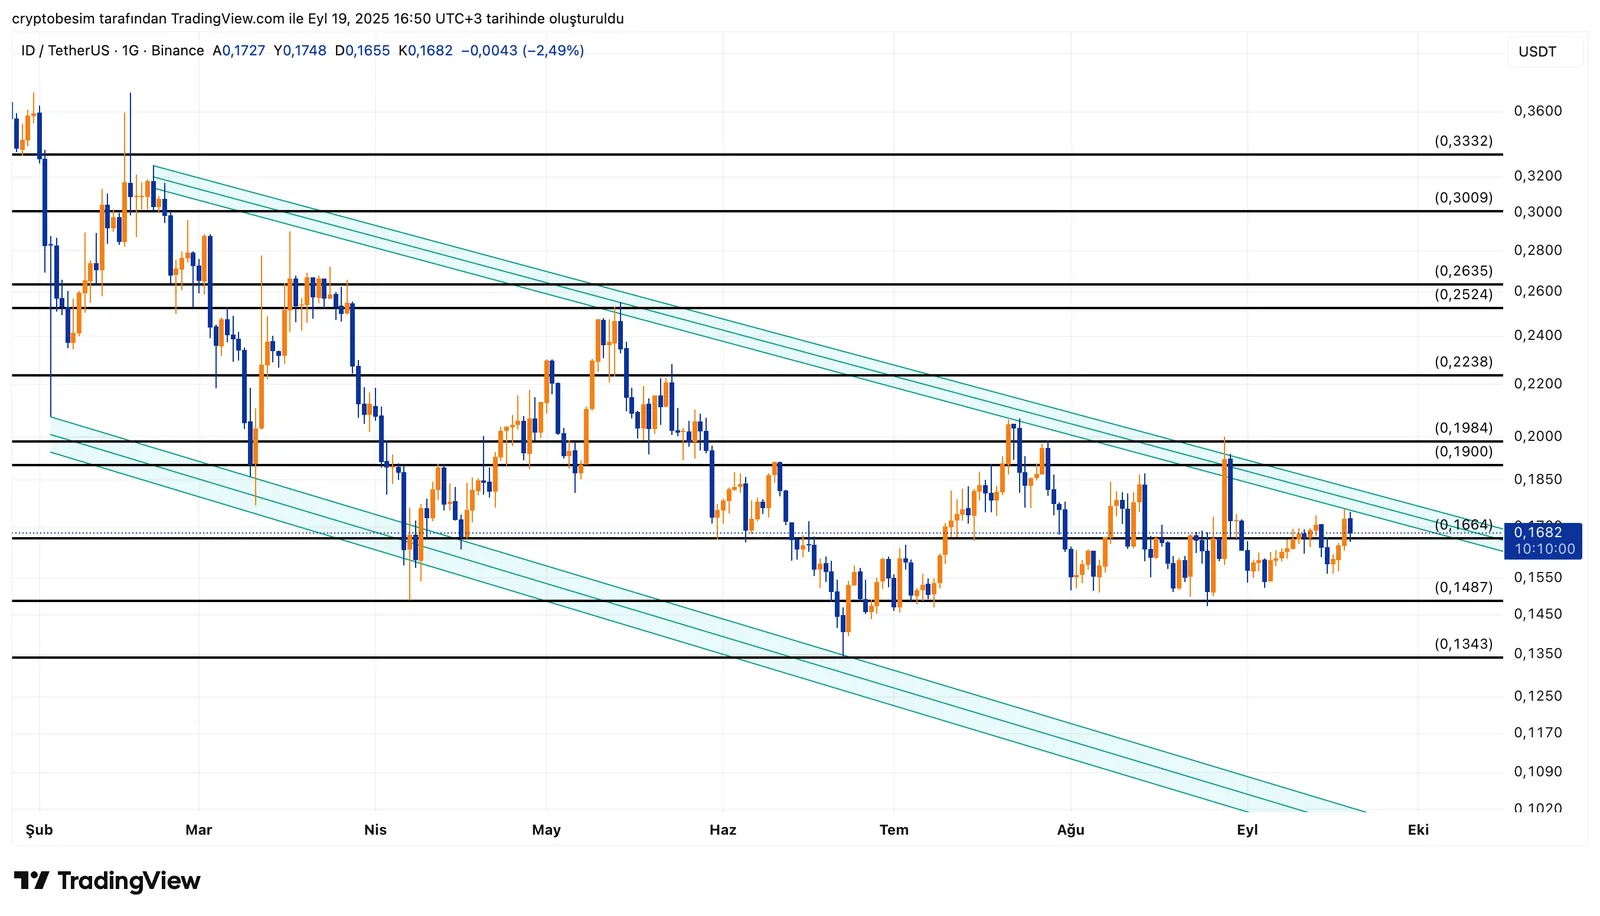
The current price is around the level $0.1682, suggesting a short-term positive outlook.
The nearest support stands at the level $0.1664 in the short term now. Holding above this support could pave the way for the range between the levels $0.1900–$0.1984. This zone is crucial for a potential breakout as it aligns with the upper border of the channel. The price of the coin is likely to aim for the levels $0.2238, followed by $0.2524–$0.2635 if it sees daily closes above $0.1984.
According to a bearish scenario, the first support to follow is $0.1487; below it, the price could pull back to the levels $0.1343 and even $0.1170.
If the channel breaks to the upside, the technical target would be a move equal to the channel’s height, potentially pushing the price into the $0.30–$0.36 range in the medium term.
Summary:
- Current price is around $0.1682
- Holding above $0.1664, the price targets $0.1900–$0.1984
- Holding above $0.1984 could open the way for $0.2238 and $0.2524–$0.2635
- Below $0.1487, the price could test $0.1343 and $0.1170
- A breakout of the channel makes $0.30–$0.36 potential targets
These analyses, not offering any kind of investment advice, focus on support and resistance levels considered to offer trading opportunities in the short and medium term according to the market conditions. However, traders are responsible for their own actions and risk management. Moreover, it is highly recommended to use stop loss (SL) during trades.


