
ID/USDT Technical Analysis
In the Space ID ecosystem, approximately 4.42 million dollars worth of ID tokens entered circulation on December 22, 2025. This means that a significant portion of the total supply was unlocked and it boosted market liquidity. This token unlock, together with the project’s goal of providing Web3 identity and domain name services, may create short-term volatility in price movements. Space ID offers an infrastructure that simplifies user experience through cross-chain domain name support and digital identity solutions; this is one of the main factors keeping investor interest alive.
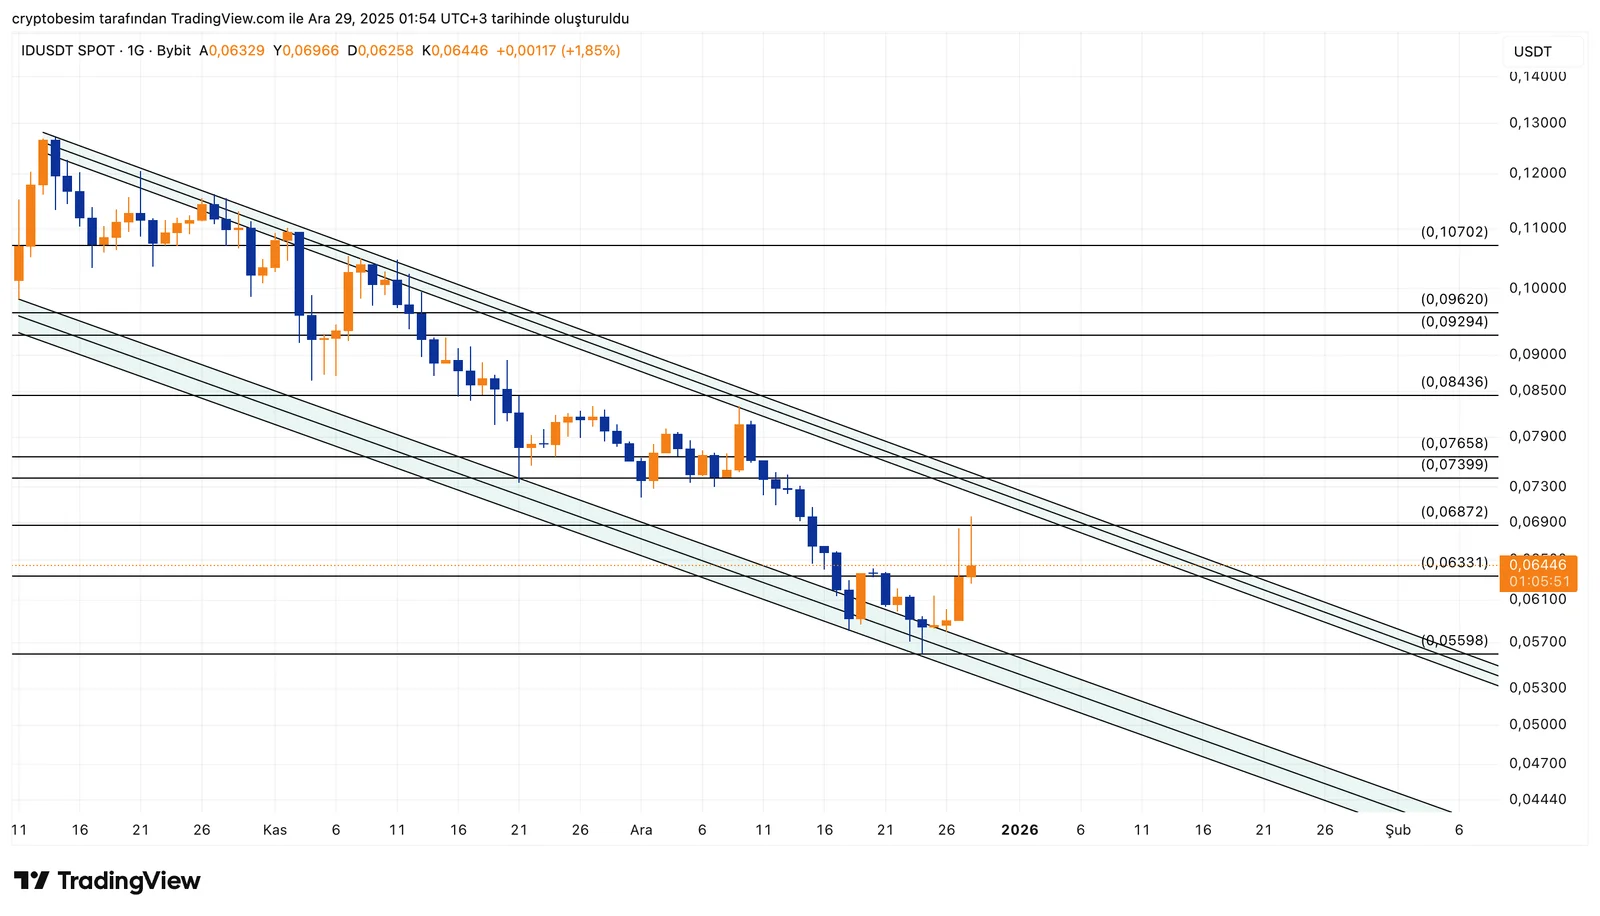
On the ID side, the structure on the daily chart is clearly a descending channel. For a long time, the price has moved in a disciplined manner between the lower and upper bands. With the latest decline, the price dropped to the lower band of the channel and has produced its first meaningful reaction from there.
This point is technically important because in descending channels, the main data is the answer to the question:“How strong and sustainable is the reaction coming from the lower trend?”
The move we are currently seeing in ID is not a weak bounce, but a strong reaction rally that carries the intention of breaking away from the bottom.
The levels seen on the chart are:
- 0.055 – 0.056: Lower band of the channel, major bottom and the region where the reaction started
- 0.063 – 0.064: First horizontal resistance, the area where the price is currently struggling
- 0.068 – 0.069: Threshold that needs to be surpassed for the continuation of the reaction rally
- 0.073 – 0.076: In-channel mid-band and strong selling zone
- 0.084 – 0.096: Path toward the upper band of the channel, but only possible with strong momentum
In the short term, the scenario is progressing clearly:As long as the price can hold above 0.063, the reaction coming from the bottom may continue toward the 0.068–0.069 band. This area is a decision point because it is both a horizontal resistance and the region where previous declines accelerated.
The real critical threshold is the upper band of the channel. Without daily closes above this region, every rise technically works as a selling opportunity. In other words, saying “the trend has reversed” prematurely here would be against the structure.
On the downside, the picture is simpler:Closes below 0.055 show that this reaction has failed and that the price has entered a new lower-testing phase within the channel.
These analyses, which do not provide investment advice, focus on support and resistance levels that are thought to create short- and medium-term trading opportunities depending on market conditions. However, the responsibility for trading and risk management belongs entirely to the user. In addition, it is strongly recommended to use stop loss for the positions shared.


