
HYPE/USDT Technical Outlook
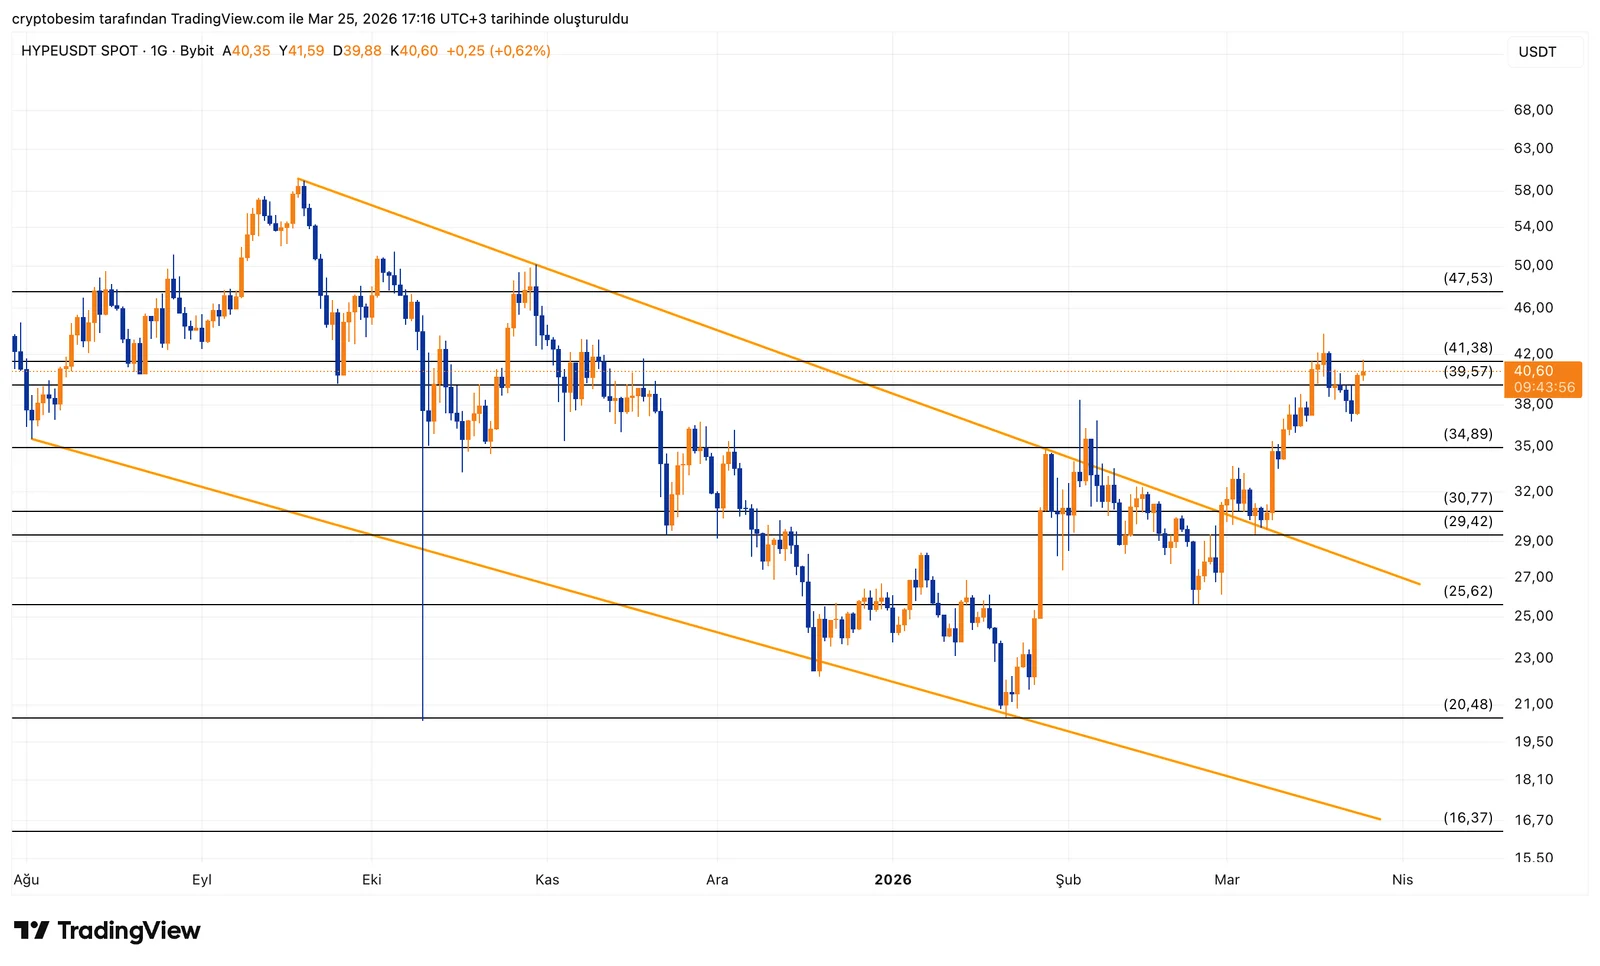
On the HYPE side, the long-standing downtrend structure has been broken, and the price has shifted into an upward character. With the move following the breakout, highs have also started to move higher. In terms of structure, the picture has changed, and the transition from downward to upward is clearly visible.
Currently, the price is in the 40–41 range, and this area is creating short-term selling pressure. It previously acted as resistance around these levels, and a similar reaction is being seen now. Failing to break it on the first attempt is normal, because after a breakout, price usually takes a breather.
On the downside, the 30–34 range stands out. This area aligns with both the previous consolidation zone and Fibonacci levels. For this reason, if a pullback occurs, this region appears to be a healthier long base. When price wants to move upward, it typically regains strength in such zones.
On the upside, if 41 is broken, the move may gain momentum again and open space toward higher levels. However, in the short term, some consolidation around this area would not be surprising.
Looking at the overall picture, the structure is now upward. Pullbacks do not appear as a breakdown but rather as the market creating space for continuation. The key point is where price finds support during declines. As long as the 30–34 range holds, this positive structure remains intact.
These analyses do not provide investment advice and focus on support and resistance levels that are considered to offer short- and medium-term trading opportunities depending on market conditions. However, responsibility for execution and risk management lies entirely with the user. In addition, the use of stop loss is strongly recommended.


