
HYPE Technical Analysis
MetaMask is preparing to launch in-wallet perpetual trading through Hyperliquid. This upgrade, allowing users to access a decentralized exchange (DEX) experience directly within the wallet interface, could boost on-chain trading volume.
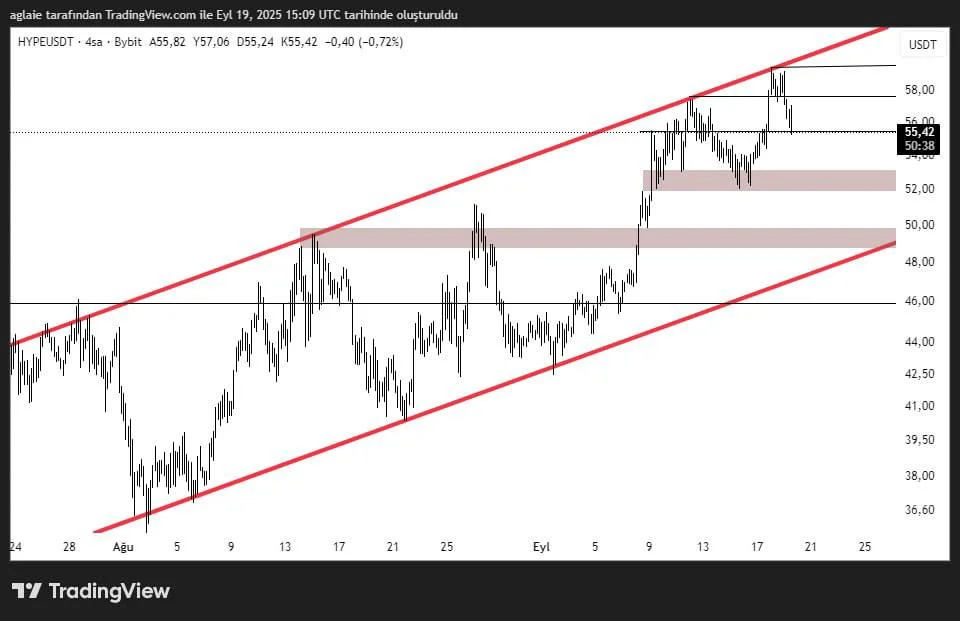
Analyzing the HYPE chart on a 4-hour time frame, we can clearly see that the price is trading inside an ascending channel. Starting from $36, the uptrend recently tested the upper border at $58; however, profit-taking at this level has pulled the price back to around $55.
The price of the coin is struggling to stabilize around the middle line of the channel after the pullback. HYPE is likely to move back to the level $58 if the support range between the levels $52–$53.5 can hold. In such a scenario, the price could aim for the levels $60.8 and $64.5.
The lower border of the channel at $48 is crucial in terms of the trend. We can say that the current pullback looks like a healthy correction; however, the price could pull back to the range between the levels $48–$50 if we see a close below $52. If this zone breaks downward, the bullish structure will be invalidated, and a negative scenario could play out.
To summarize, we can say that HYPE still displays a strong technical pattern. The harmony between volume and formation, in particular, supports this technical outlook positively.
These analyses, not offering any kind of investment advice, focus on support and resistance levels considered to offer trading opportunities in the short and medium term according to the market conditions. However, traders are responsible for their own actions and risk management. Moreover, it is highly recommended to use stop loss (SL) during trades.


