
FIDA/USDT Technical Analysis
Analyzing the chart, we see a very similar pattern to AXAV chart on the daily time frame. The price of the coin has dropped all the way down to the lower band of the descending channel and has seen a small bounce from that level. This reaction indicates that the channel bottom is still holding and sellers are weakening in this area.
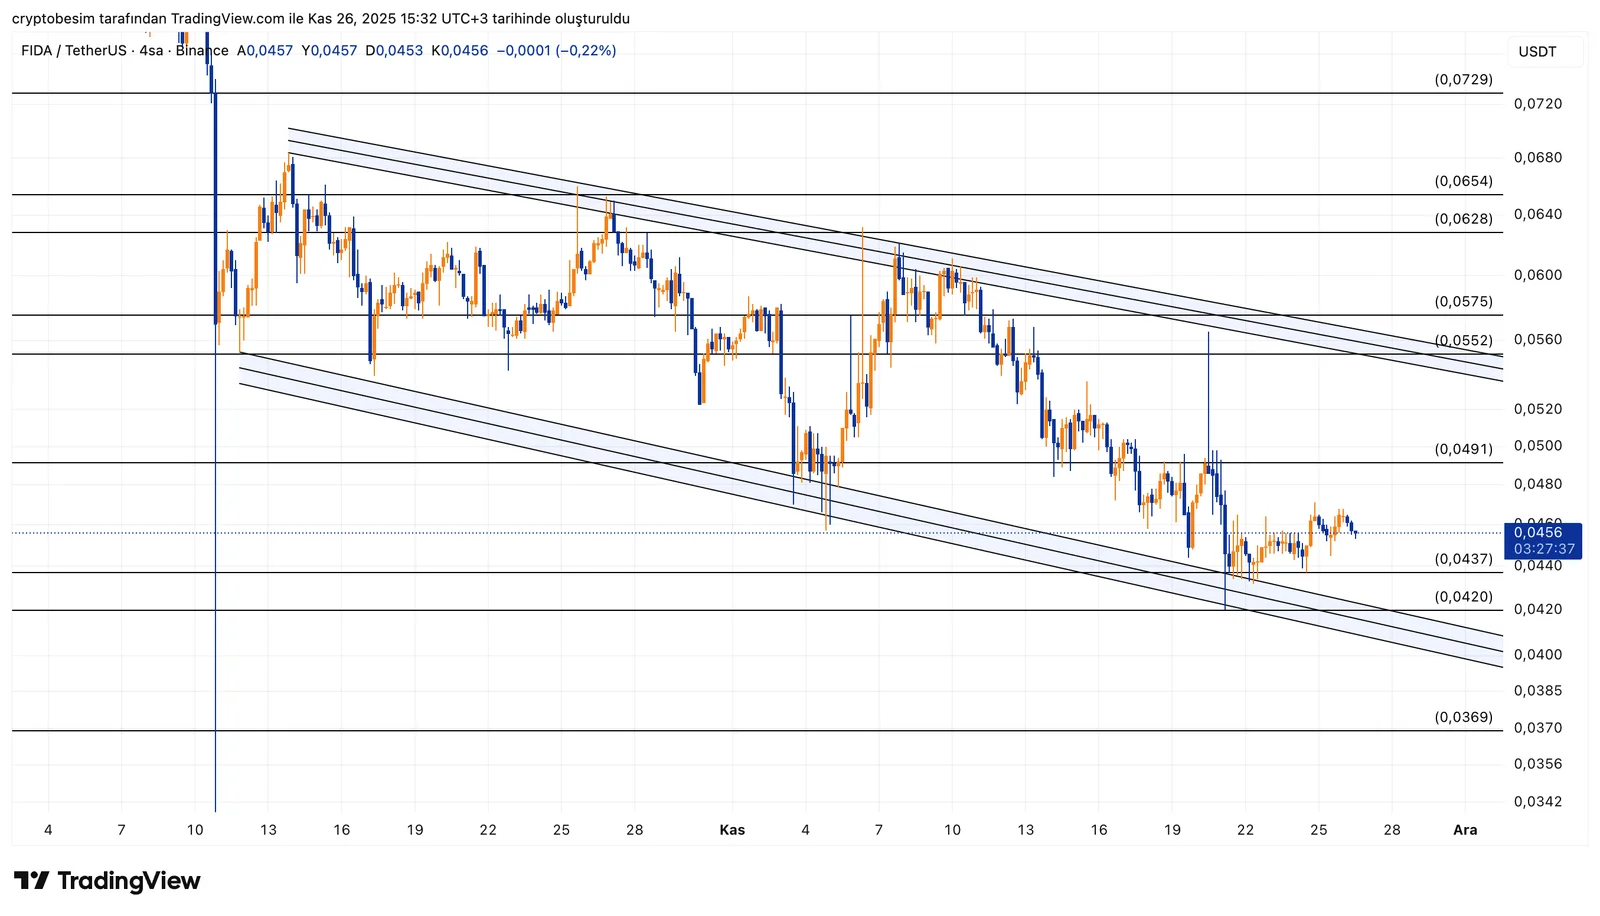
The price continues to move inside the channel with a sideways–downward structure, and the first short-term target is the mid-line of the channel, located around $0.0480 – $0.0491. If the price can break above this region, the price will gain more room to move, and the natural target will become the upper band of the channel. The upper channel zone sits at $0.0550 – $0.0575. This area is crucial as it combines both a horizontal resistance and the top of the descending channel — making it the key level for the short-term bullish scenario. However, $0.0437 is the first support below. If the price drops below this level, a move back toward $0.0420, which is the lower channel band, becomes likely. As long as this lower band holds, the structure remains a healthy down-channel movement rather than a breakdown.
These analyses, not offering any kind of investment advice, focus on support and resistance levels considered to offer trading opportunities in the short and medium term according to the market conditions. However, traders are responsible for their own actions and risk management. Morover, it is highly recommended to use stop loss (SL) during trades.


