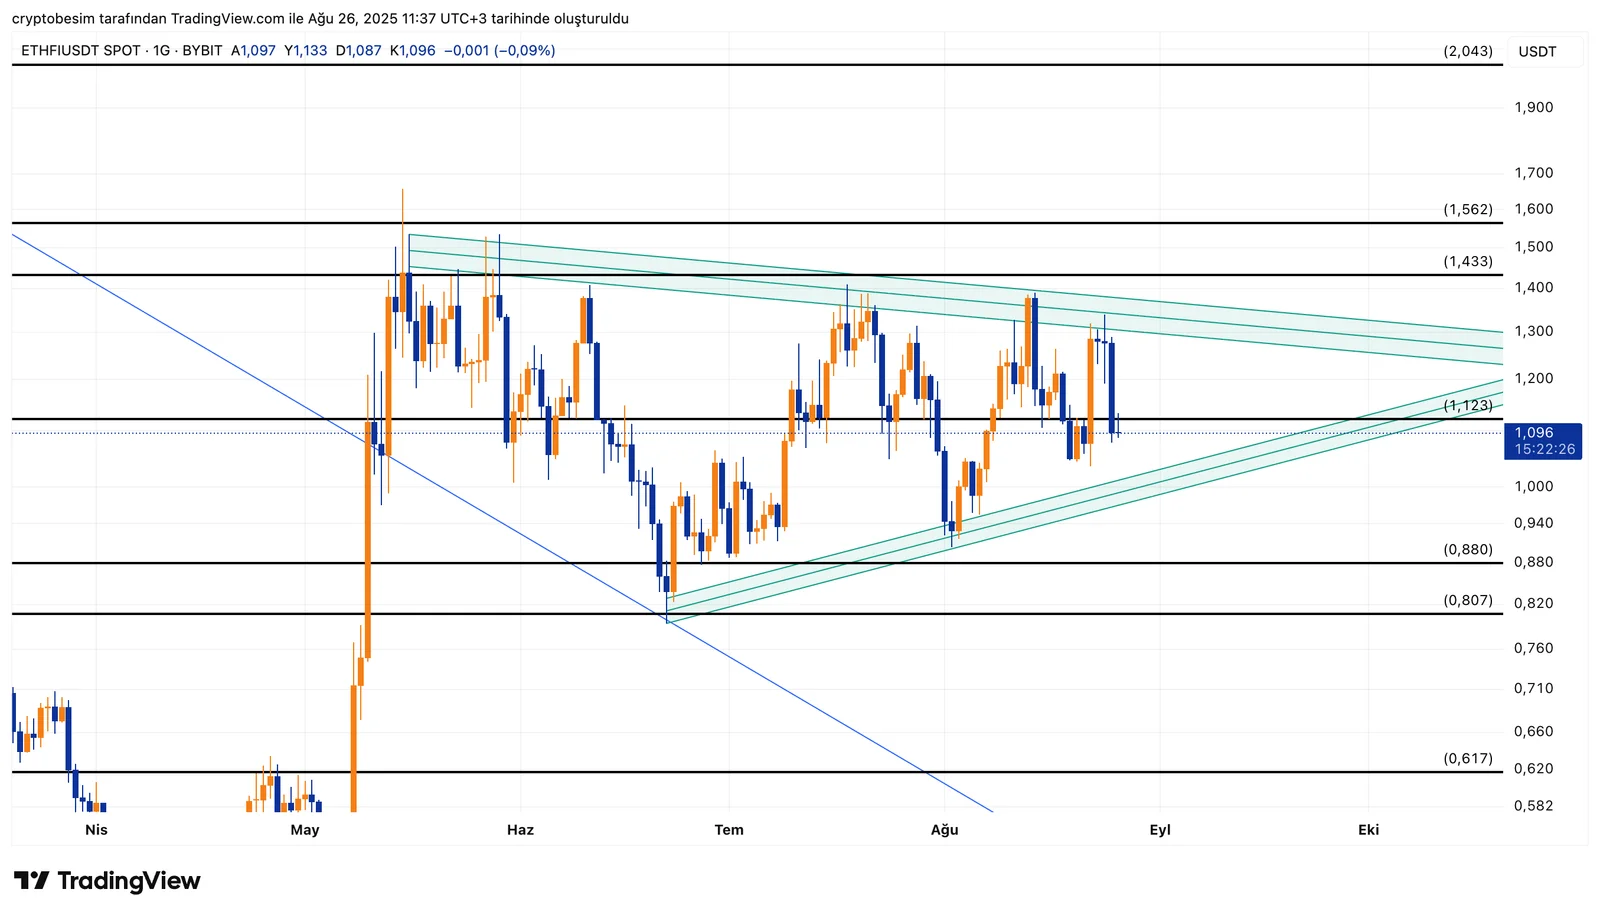
ETHFI/USDT Technical Analysis
There is a standing symmetrical triangle formation on the ETHFI chart, yet the price has slipped below the support level, suggesting that the bearish scenario has strengthened.
The current price is hovering around $1.31. Since the mid-band of the formation at $1.12 has been broken to the downside, this level has now turned into a resistance zone. Following this breakdown, the first trend support stands at $1.09, while more critical horizontal levels are seen at $0.95 and $0.88. If these areas fail to hold, we could see a deeper move toward the $0.80 range.
On the upside, a recovery would require the price to climb back above $1.12. Without sustainable consolidation above this level, upward moves will remain weak. However, in the case of a strong reversal, targets at $1.35 – $1.43, followed by $1.56 and $2.05, could come back into play.

Summary
- Formation: Triangle Formation
- Key resistance: $1.12
- Support levels: $1.09 → $0.95 → $0.88 → $0.80
- Upper targets: $1.35 → $1.56 → $2.05
These analyses do not constitute investment advice and focus on support and resistance levels that may present potential trading opportunities in the short and medium term, depending on market conditions. However, the responsibility for executing trades and managing risk lies entirely with the user. It is also strongly recommended to use stop-loss orders for any trades mentioned.


