
ETHFI Technical Analysis
Looking at the ETHFI chart, the price is trying to break out of the long-term descending channel and there is an important formation appearing since the end of June. The cup-handle formation could be giving a signal to a potential price rise, which is currently trading at around $0.89. This price level is very close to the downtrend resistance and the cup neckline.
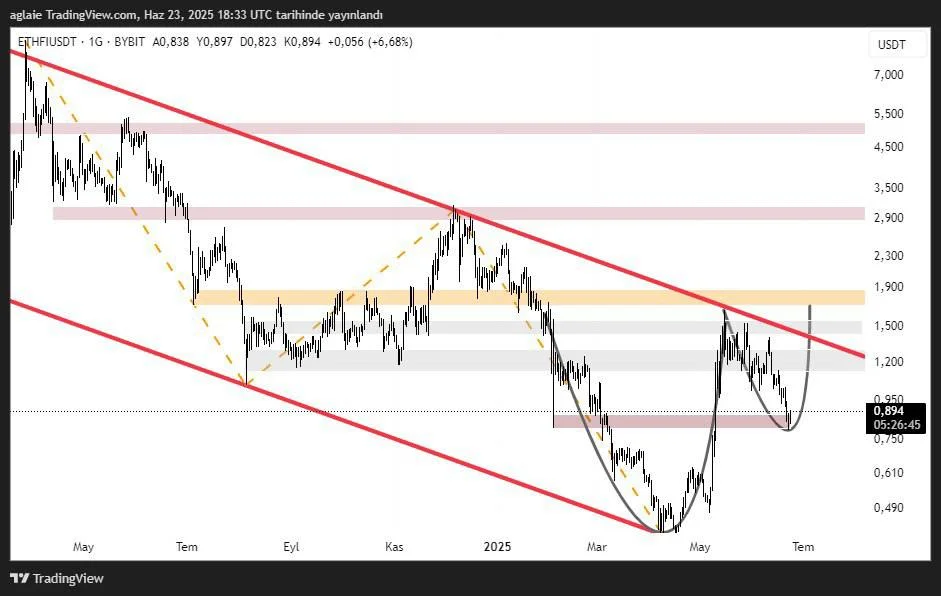
According to the previous price actions, we can say that the range $0.75–$0.80 is an area where buyers outperform sellers. Looking at the current price movements, the price has recovered from this support zone and an upward momentum is beginning to gain strength. Should the price hold around this level and succeed to exceed $1.80, the neckline of the cup-handle formation, it can test $2.90 in the short term and then we can speak of the level $4.80.
However, we should bear in mind that the price of the coin is likely to meet a strong sell pressure here as the upper band of the descending channel is in this area, which is why $1.20 should be followed as the descending trend resistance. Also, the cup-handle pattern could spoil in case of pullbacks from this area. Price closings below the level of $0.80 might cause the current price recovery to weaken if the price reaction here is not permanent and the neckline breaks downwards. Should this scenario work, then we can talk about the support levels $0.70–$0.65, below which the possibility of a deep correction towards the bottom rises.
These analyses, not offering any kind of investment advice, focus on support and resistance levels considered to offer trading opportunities in the short and medium term according to the market conditions. However, the user is responsible for their own actions and risk management. Moreover, it is highly recommended to use stop loss (SL) during the transactions.


