
ETHFI/USDT Technical Analysis
We’re ending the week on a positive note for EtherFi. The protocol’s DAO has proposed a token buyback of up to $50 million from its treasury. This move is widely seen as a strong signal of confidence — aiming to control circulating supply and support ETHFI’s token value.
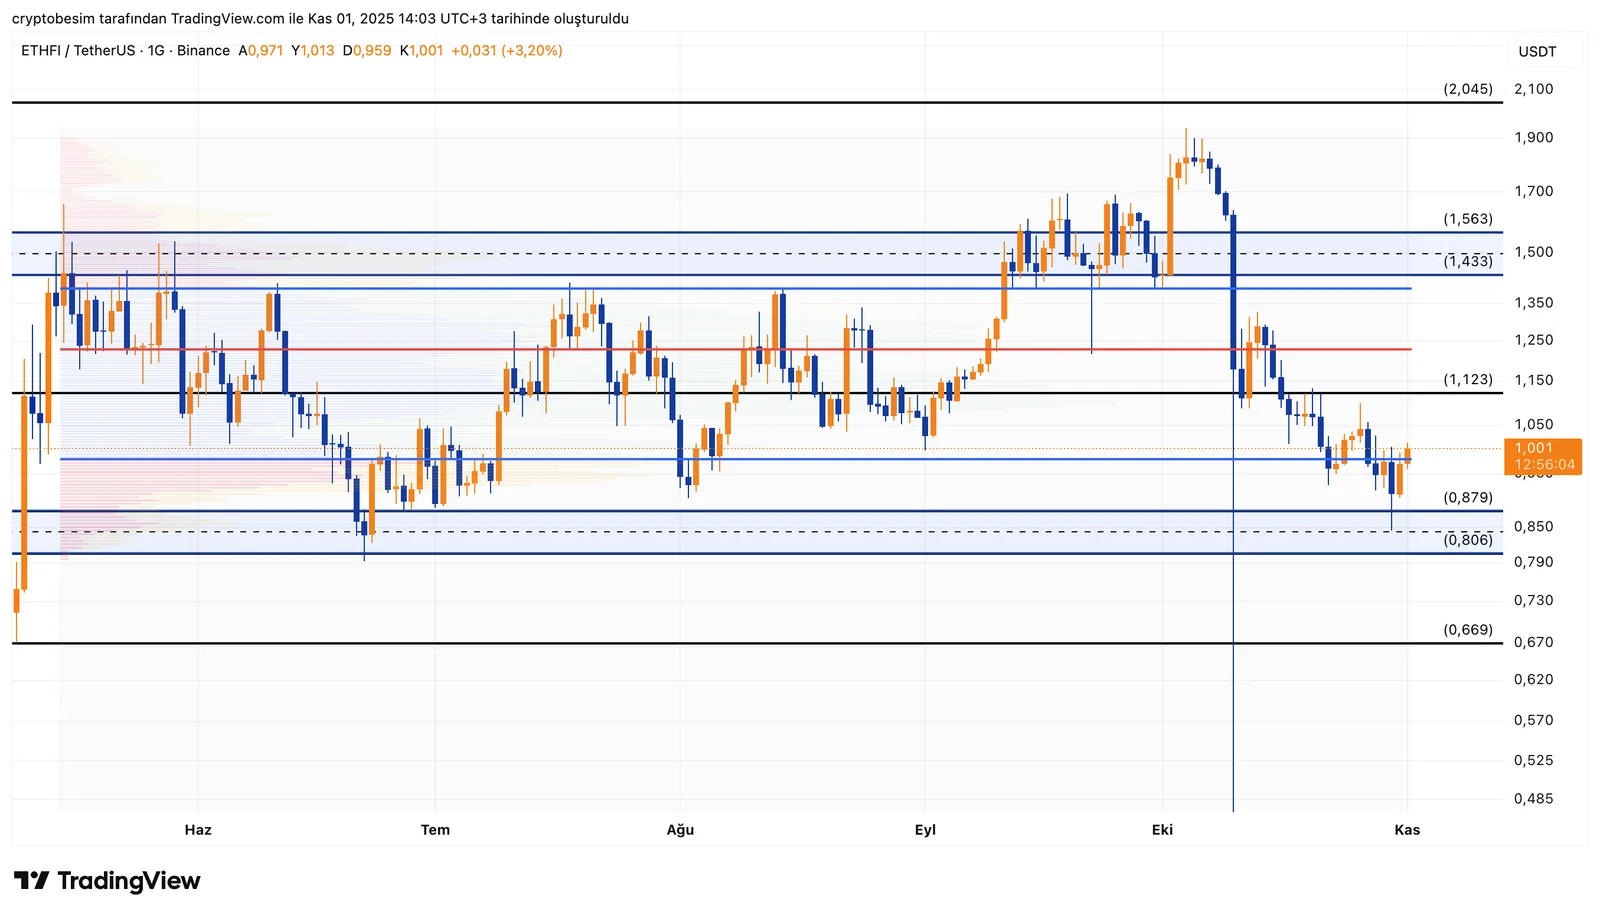
Analyzing the chart on a daily time frame, we see that the coin keeps moving within a broad range structure. The price has recently bounced strongly from the lower range band at $0.80–$0.88, showing early signs of recovery. This zone has acted as a key demand and support area multiple times before. The first resistance in the short term to watch is $1.12. A breakout above this level could open the door for a move toward $1.43, which aligns with the mid-range resistance and serves as a major barrier.
On the other hand, maintaining support above $0.88–$0.80 remains crucial for the ongoing trend. A daily close below this area could increase selling pressure and trigger a deeper pullback toward $0.66.
- Support and Resistance LevelsSupport: $0.88 – $0.80 – $0.66Resistance: $1.12 – $1.43 – $1.56 – $2.04
- Summary• ETHFI has rebounded strongly from the lower range support.• Key breakout zones: $1.12 and $1.43.• As long as the $0.80–$0.88 support holds, recovery momentum remains intact.• A close below $0.80 would weaken the technical outlook.
These analyses, not offering any kind of investment advice, focus on support and resistance levels considered to offer trading opportunities in the short and medium term according to the market conditions. However, the user is responsible for their own actions and risk management. Moreover, it is highly recommended to use stop loss (SL) during the transactions.


