
ETH Technical Analysis
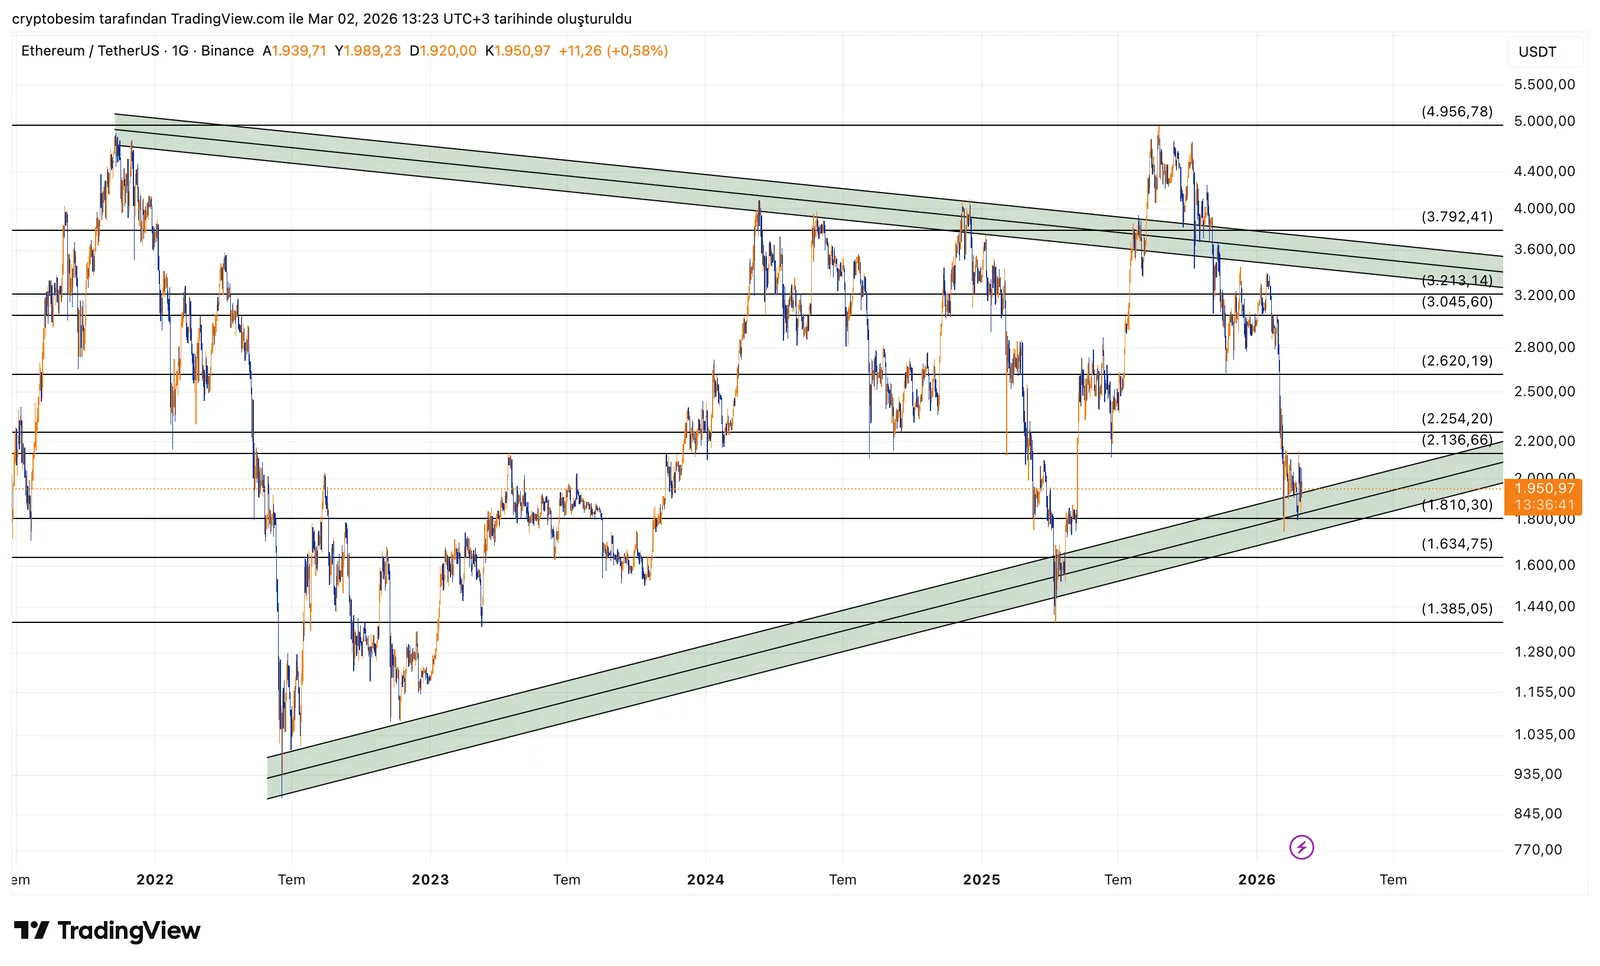
On ETH, price is still trading inside that long-term triangle structure. During the latest sharp drop, it extended to the lower band of the triangle and reacted from there. In formations like this, intraday wicks are common. What truly matters is whether weekly closes remain inside the triangle.
At the moment, price appears compressed within the 1810 – 2130 range. The 1810 level acts as the structural base. As long as this area holds, the market can continue attempting upside moves. If price establishes acceptance above 2130, the first level to watch becomes 2254. A break there opens the path toward 2620. Beyond that, the 3045 – 3213 zone stands out as the broader resistance cluster, aligning with previous congestion and acting as a significant supply area.
On the downside, the main risk emerges if price breaks below 1810 and delivers a weekly close beneath it. In that case, the structure weakens and a pullback toward 1635, followed by 1385, remains possible.
In summary, as long as the triangle’s lower band is protected, recovery attempts stay on the table. Sustained price action above 2130 would shift short-term momentum upward. During periods of intensified news flow, the first structural cracks often appear within compression zones like this. For that reason, weekly behavior around 1810 and 2130 deserves close attention.
These analyses do not provide investment advice and focus on support and resistance levels that are considered to offer short- and medium-term trading opportunities depending on market conditions. However, responsibility for execution and risk management lies entirely with the user. In addition, the use of stop loss is strongly recommended.