
ETH Technical Analysis
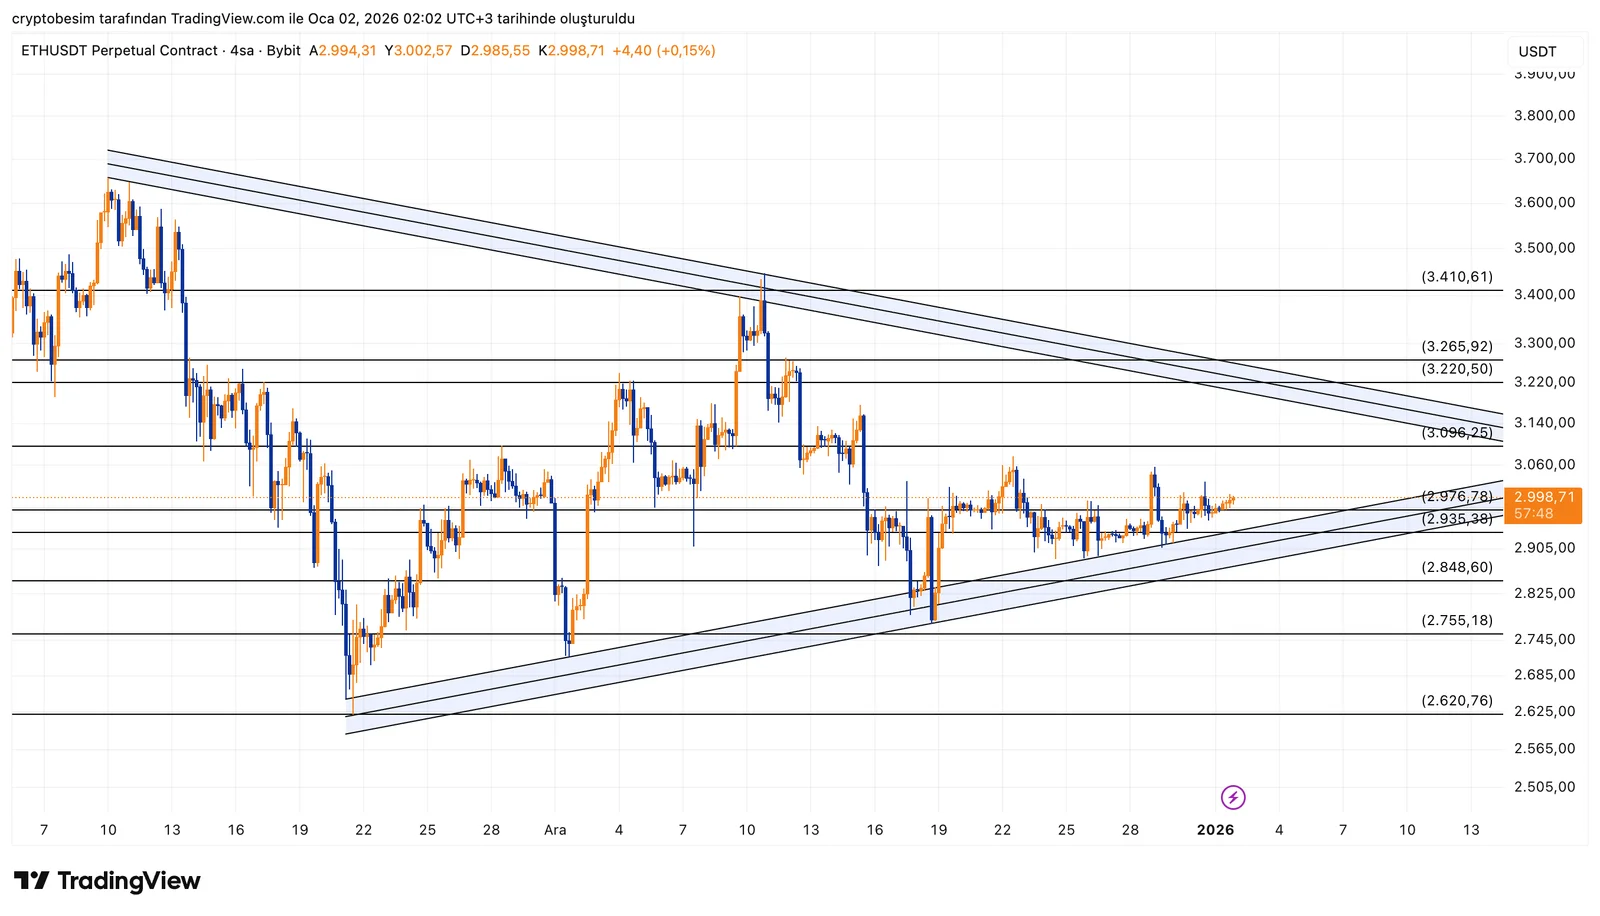
On the ETH side, the price is squeezed within a clear symmetrical triangle structure between a descending trend coming from above and a rising trend coming from below. The size of the triangle has narrowed significantly and the price appears to be approaching the end of the formation, which increases the likelihood of an imminent breakout. The decrease in volatility and the shortening of candle sizes also confirm this compression.
Within the current structure, the lower trend has worked so far and has continued to support the price from below. The preservation of this trend shows that the structure is still valid and that the upside scenario remains on the table. As long as the lower trend is not lost, pullbacks for now appear as movements within the formation.
On the upside, the 3,220 region stands out horizontally as a critical threshold due to both being an area previously tested by price and intersecting with the upper trend of the triangle. A move toward this region emerges as the natural target of the formation. However, it is also clear that this same area is a strong decision zone, and it would not be surprising to see sharp reactions before a breakout occurs.
In summary, ETH is moving within a symmetrical triangle that has reached a decision moment. As long as the lower trend is preserved, the main short-term expectation is upward acceleration and a test of the 3,220 region. The reaction given at this level will be decisive for the next direction.
These analyses, which do not provide investment advice, focus on support and resistance levels that are thought to create short- and medium-term trading opportunities depending on market conditions. However, the responsibility for trading and risk management belongs entirely to the user. In addition, it is strongly recommended to use stop loss for the positions shared.


