
ETC /USDT Technical Analysis
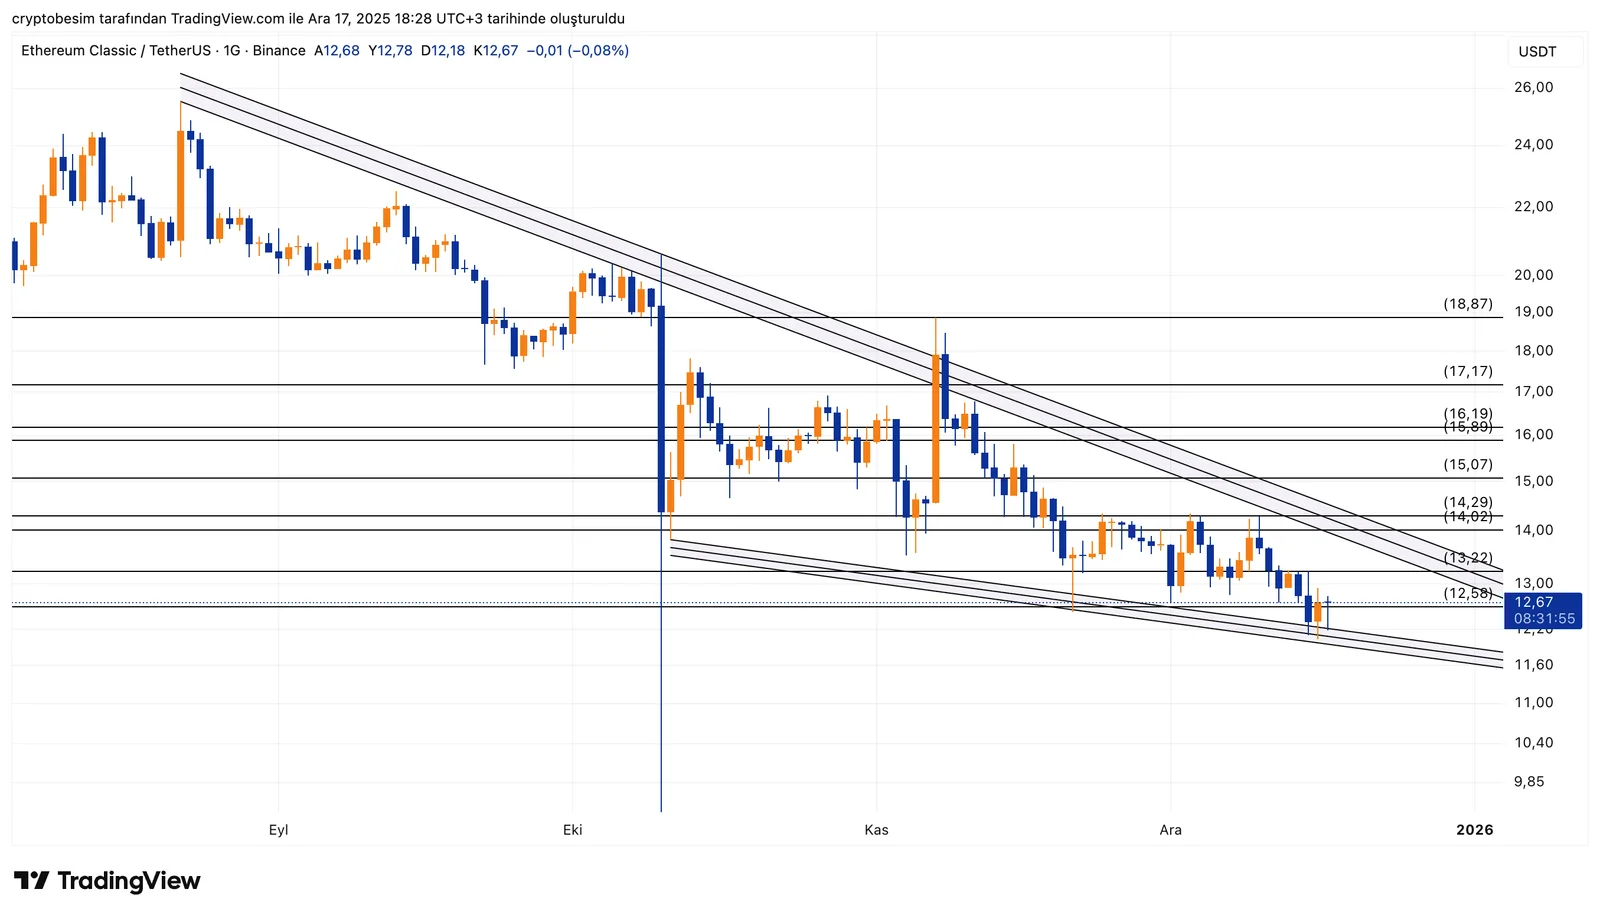
Analyzing the chart of the coin on a daily time frame, we see that ETC is tightly compressed within a descending wedge pattern. The price has been drifting lower inside this pattern for a long time, but in recent candles both volatility and price range have narrowed significantly. This suggests that selling pressure is weakening, but there is still no clear direction. The market is at a decision point.
The $12.50–$12.30 zone is the main support area in the short term. The price is currently holding just above this level, which almost perfectly matches the lower boundary of the wedge. As long as this support holds, the possibility of an upward breakout remains alive.
On the upside:
- $13.20–$13.50 is the first key resistance, acting as both horizontal resistance and the upper trend line of the wedge.
- A strong, high-volume break above this area would confirm an upside breakout and could push the price toward $14.30.
- After that, $15.80–$16.20 becomes the major target and resistance zone, as it marks the area where the previous decline started.
On the downside:
- Daily closes below $12.30 would trigger a downward breakout of the wedge.
- In this case, the price could move toward $11.80–$11.60.
- This zone is the last major support; losing it could accelerate the downtrend.
In summary, ETC is highly compressed within a descending wedge. If support holds, a sharp upside move is possible. If $12.30 is lost, downside pressure increases. The next major move will depend on which direction this tight structure breaks.
These analyses, not offering any kind of investment advice, focus on support and resistance levels considered to offer trading opportunities in the short and medium term according to the market conditions. However, the user is responsible for their own actions and risk management. Morover, it is highly recommended to use stop loss (SL) during the transactions.


