
DOT/USDT Technical Outlook
Polkadot keeps standing out among Web3-focused projects in 2026. DOT is getting attention again, especially from institutional players thanks to its technology that connects different blockchains. Major platforms like Ledger and Robinhood have recently brought DOT back into focus. Polkadot ecosystem is becoming more user-friendly with improvements in staking and governance, Morover, Polkadot 2.0 is expected to offer more flexible tools for developers, which is sre to support its long-term growth.
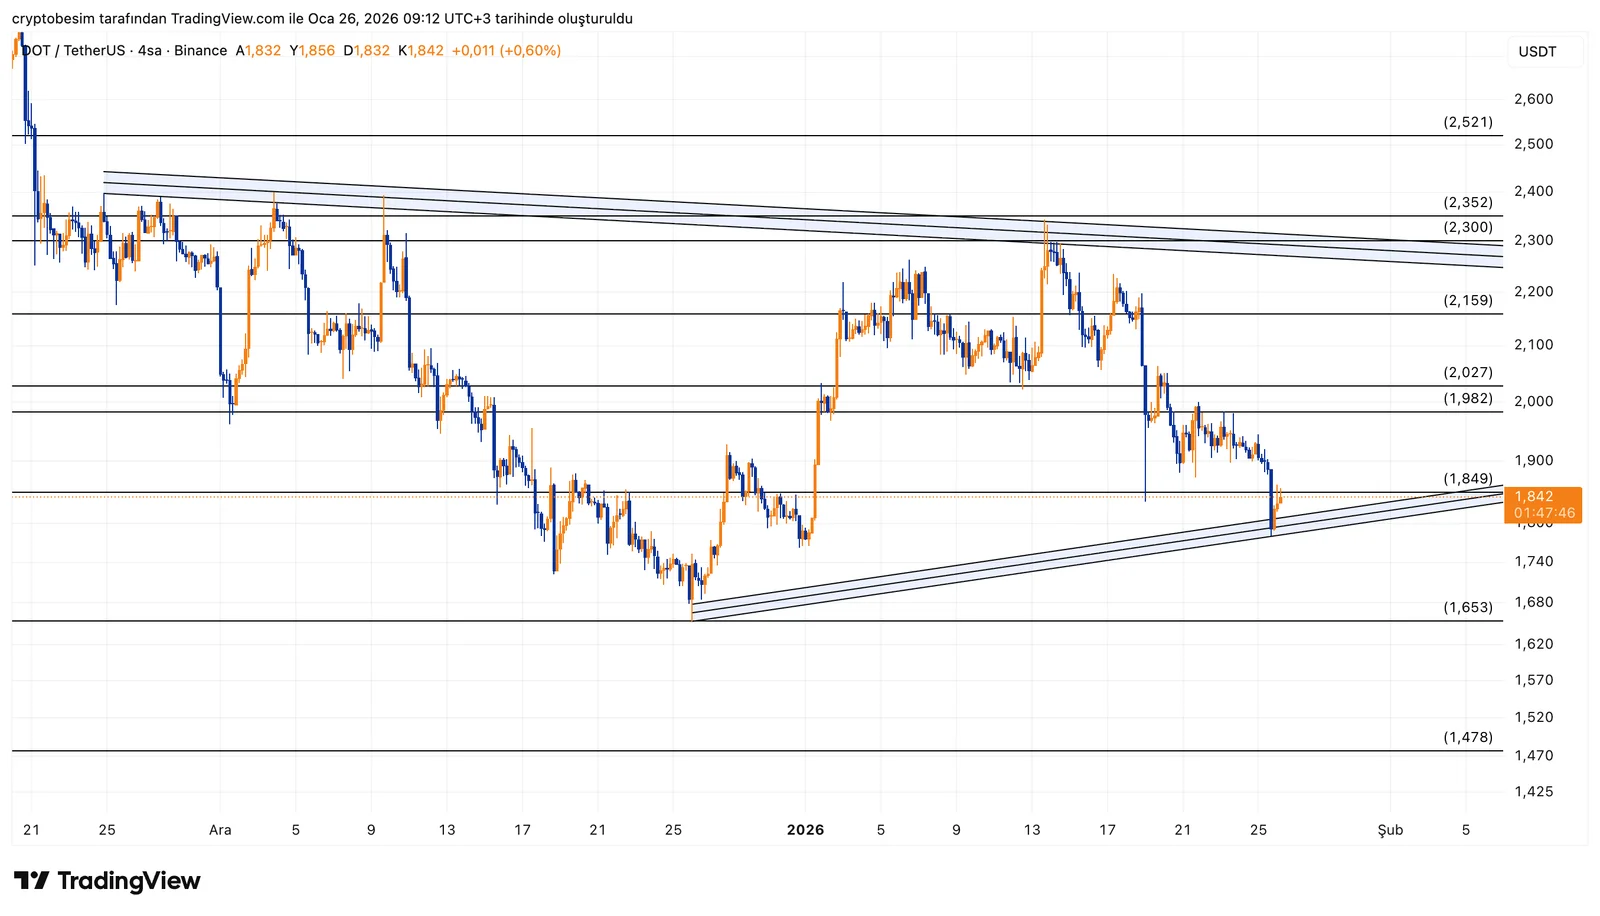
DOT is currently forming a tight triangle pattern. The price is squeezed between a descending resistance from above and a rising support from below, which means the market is approaching a decision point, and a strong move is possible.
$1.65 – $1.85 zone is the triangle’s compression area. Price is holding here, and movements inside this range are still neutral. If price breaks above the upper trendline, the first target would be $2.00 – $2.05 and the next resistance levels are $2.15 and $2.30. If price breaks below the lower trendline the first target would be $1.65, below which the structure is considered fully broken.
Summary :
DOT is at a decision stage. Triangle patterns usually end with a sharp move. From a technical perspective, entering a position after a clear breakout and candle close outside the triangle is a safer approach. As long as price stays inside the triangle, the market remains in wait-and-see mode.
These analyses, not offering any kind of investment advice, focus on support and resistance levels considered to offer trading opportunities in the short and medium term according to the market conditions. However,traders are responsible for their own actions and risk management. Morover, it is highly recommended to use stop loss (SL) during trades.


