Bitcoin Dominance Cycle: Altcoin Bull Runs Occur Systematically
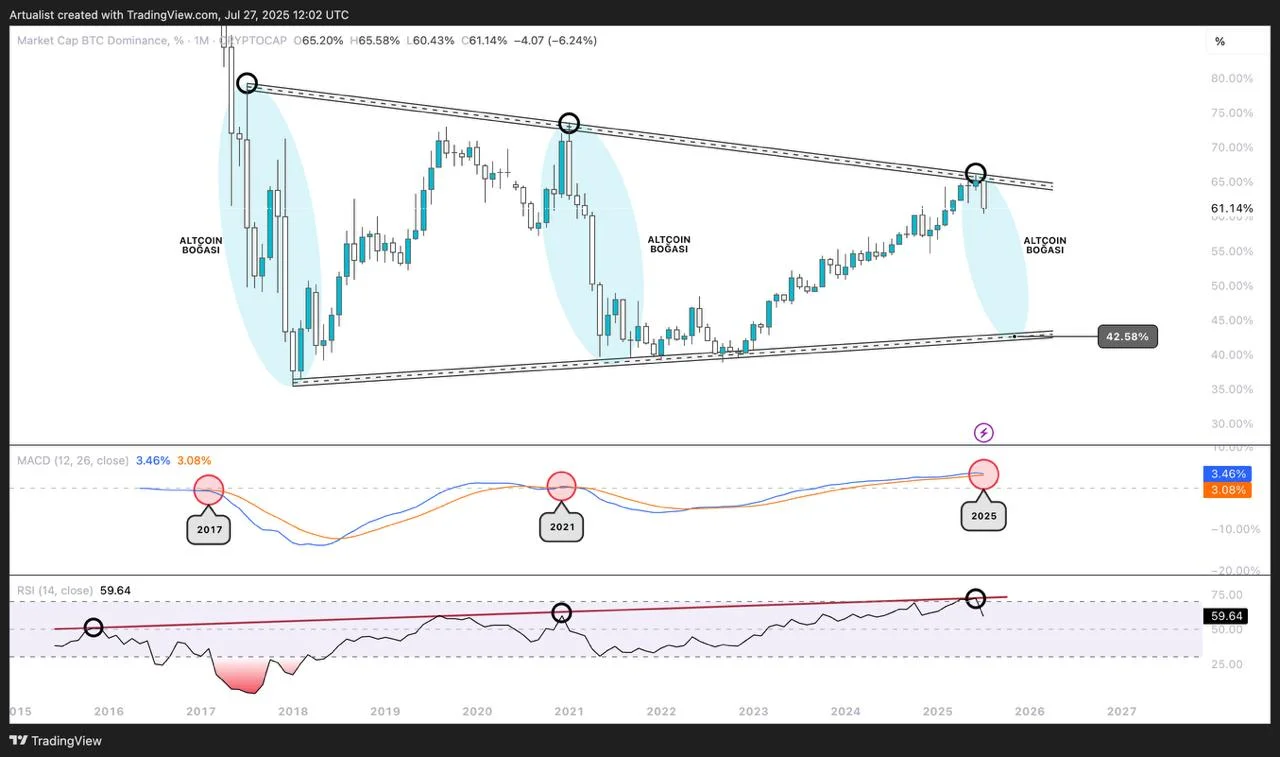
The pattern on the chart on a monthly time frame shows the BTC dominance cycle that has been forming since 2016. This isn't just a chart but a system precisely showing the structural conditions and technical triggers initiating three separate altcoin bull runs. Different coins flourished in each cycle, but the triggering structure was always the same. And now, the 2025 altcoin rally is at the threshold where that structure re-forms, counting the days until it begins.
Every one of the major peak formations for BTC.D has been the starting point for subsequent altcoin bull runs. These peaks occurred both when downward resistance trends rejected and when oscillators like the MACD and RSI showed signs of deterioration. The 2017 and 2021 altcoin bull runs were built on these structures. And now, the same scenario is being repeated for 2025.

Cyclical Pattern: Three Bulls, Three Rejections, Three Opportunities
The dominance chart has a distinct descending wedge structure over a long period. Each peak formed lower than the previous one. At the 2017 peak, dominance was approximately 72%. The 2021 peak was limited to 70%. The 2025 peak was rejected around 65%. This is a cyclical scenario based not only on price but also on timing and momentum.
In 2017, 2021, and now 2025, the price hits this descending trendline, gets rejected, and then the altcoin bull run begins. This isn't just a historical coincidence. From a technical perspective, the declines following these breakouts led to a decline in BTC dominance and booms in altcoins, resulting in out-of-market returns.
After each rejection, dominance fell to the 42–45% range. If the same thing happens again, and structurally all conditions are the same, it is not at all unlikely that BTC.D will ease to this band again and altcoins will rally between 300% and 1000% in the meantime.
MACD: 3 Triggers, 3 Bullish Crossings
The MACD data in the bottom panel has shown the same signal in 2017, 2021, and now 2025: The MACD line crossed on the monthly chart, initiating a transition into the red zone. This signal perfectly timed the periods in the previous two cycles when BTC dominance declined and altcoin bullish activity began.This is the third time the same pattern has formed. Such oscillator signals are rare in the long term, and when they do occur, especially on monthly charts, the probability of coincidence is almost zero. The MACD has now turned red for the third time. The result of the previous two red crossovers has been the inflow of millions of dollars of new capital into altcoins.
RSI: Uptrend Broken, Selling Pressure Begins
The ascending trend line that has been forming on the RSI since 2021 has been broken this month. The RSI rejected before reaching 70 and dropped below 60. This indicates that momentum is weakening and that BTC dominance no longer has the strength to fuel upward momentum.We saw this pattern in 2017 and 2021. The RSI failed to peak, broke below, the dominance declined, and the altcoin season began. The same pattern is being redrawn in 2025.
2025 Scenario: Altcoins Will Explode in a Few Months
If the pattern repeats, BTC.D will decline to the 42–45% range. During this period, total market capitalization will expand, Bitcoin will plateau or decline slightly, and altcoins will begin to price in a chain fashion.
In this cycle, large-cap altcoins like ETH, SOL, and XRP will first gain prominence. L2 tokens, AI coins, and low-cap Layer-1s will follow. Barring a macroeconomic shock, all technical signals suggest a chain capital rotation is imminent. This season is consistent not only with the chart but also with time. The previous two altcoin bull runs began with BTC.D hitting this resistance line, and now the third crash has occurred.Bitcoin dominance is not only technically reversing but also completing its cyclical nature. The MACD, RSI, and price structure are all converging on one point: BTC.D will fall. This decline will herald a new season of expansion in the cryptocurrency market.


