BTC, USDT.D and TOTAL: Comments and Price Analysis 21.03.2025
BTC
USDT.D
TOTAL
Bitcoin (BTC) at Critical Levels! Key Levels That Will Determine the Market's Direction
The cryptocurrency market largely moves in line with Bitcoin’s (BTC) price action. Currently, BTC is trading at critical levels, with both technical and macroeconomic factors continuing to shape the market’s direction. So, what are Bitcoin’s key support and resistance levels? Which levels need to be broken for a confirmed bull market? Here’s our in-depth BTC analysis!
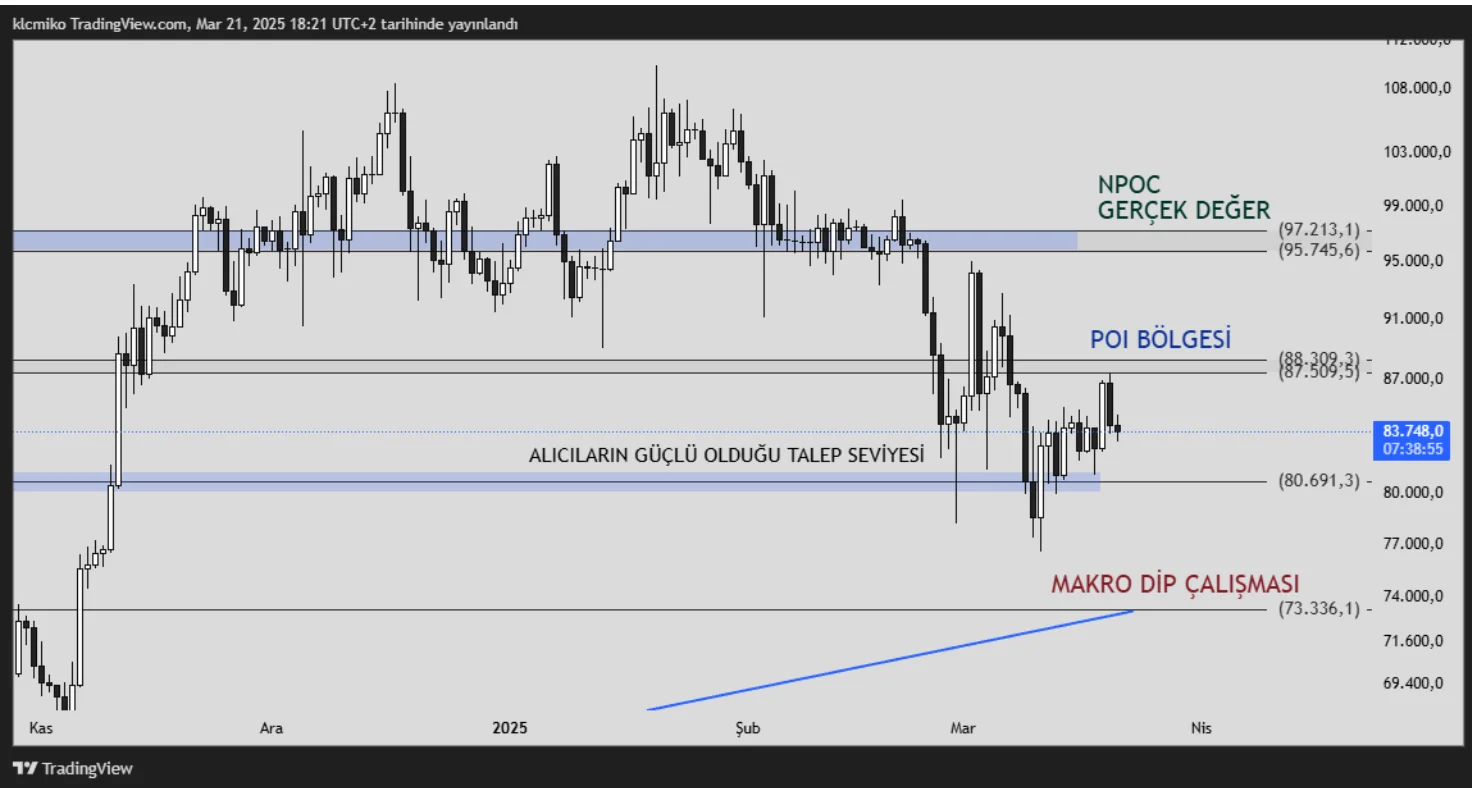
Major Support Zones and Buying Pressure
Bitcoin is seeing strong buying pressure at the $80,691 level, making it one of the most important support zones. As long as BTC holds above this level, the uptrend remains intact. However, if this support is lost, the price could pull back to $73,336.
Historically, the $73,336 level has been a key confluence zone during BTC’s massive uptrend from $15,500. When this area was tested in the past, BTC surged by nearly 150%. Therefore, long-term investors should closely monitor this level as a strong support zone.
Key Resistance Zones and Seller Strength
For upward movements, the $87,500 level acts as an SR Flip (Support-Resistance Flip) and POI (Point of Interest) zone.
This area has previously faced significant selling pressure, making it likely that BTC could consolidate here. However, if the price breaks above this level with strong volume, the next major target would be $92,591.
If $92,591 is breached, BTC is expected to move toward the $95,745 - $97,213 NPOC (Unbalanced Price Area). Although resistance could be encountered here, surpassing these levels could push BTC toward $110,000, potentially unlocking new all-time highs.
The Importance of Macroeconomic Factors
Bitcoin’s price movements are not solely dictated by technical levels. Global economic developments, central bank decisions, and macroeconomic indicators also play a major role.
The Federal Reserve’s (FED) interest rate decisions and statements regarding the U.S. economy are among the most influential factors for risk assets like Bitcoin.
If the FED keeps interest rates steady and signals a rate cut in May, this would be a bullish scenario for Bitcoin.
As inflation approaches the 2% target, markets may anticipate increased liquidity, further supporting BTC’s upward momentum.
Key Levels to Watch:
$80,691 → Strong buyer zone. If BTC remains above this level, the uptrend continues. A breakdown below this level could bring $73,336 into play.
$73,336 → Major macro support level. Historically, this level has been a launchpad for significant BTC rallies.
$87,500 → SR Flip & POI zone. A breakout above this level would strengthen the bullish scenario.
$95,745 - $97,213 → NPOC (Unbalanced Price Area). Breaking through this range could set BTC up for new highs.
$110,000 → Main target zone. Once BTC surpasses this level, price discovery could begin.
As Bitcoin navigates these critical support and resistance levels, macroeconomic developments will be one of the most important factors shaping the market’s future. Therefore, keeping an eye on both technical levels and global economic news is crucial. USDT Dominance (USDT.D) Analysis and Its Impact on the Market
One of the most important ways to understand investor sentiment and risk appetite in the cryptocurrency market is by tracking USDT Dominance (USDT.D) movements.
An increase in USDT.D indicates that investors are moving towards stablecoins and away from riskier assets, signaling a risk-off environment. Conversely, a decline in USDT.D suggests that funds are flowing into cryptocurrencies, indicating renewed risk appetite.
Therefore, analyzing how USDT.D reacts at certain levels is crucial for predicting potential market trend reversals.
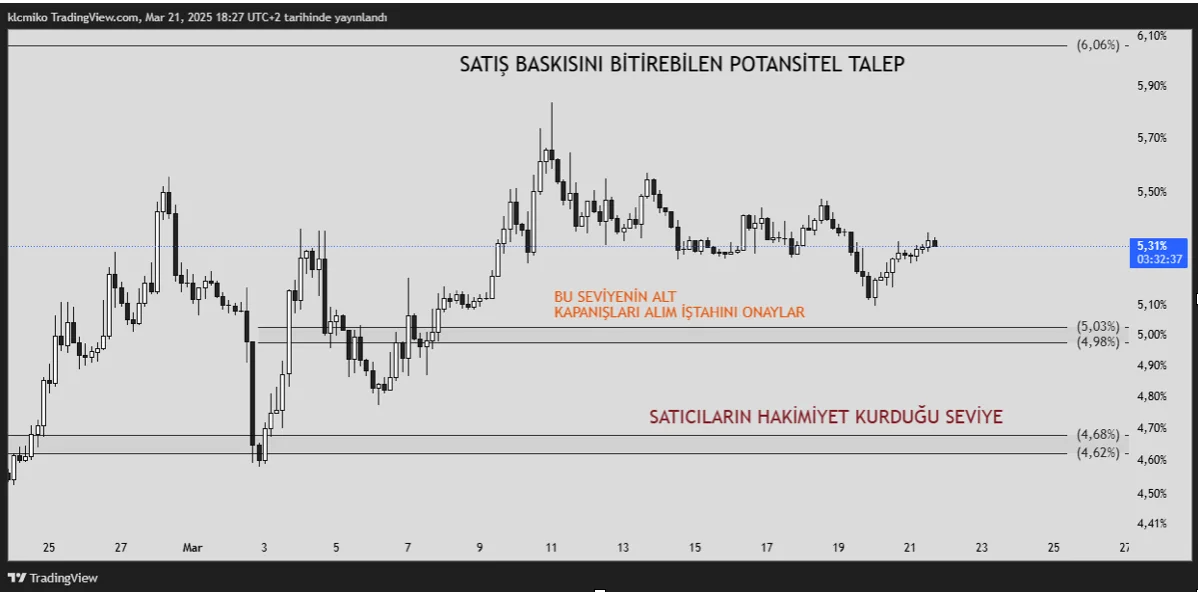
Key USDT.D Levels and Their Market Impact
🔴 6.06% – Peak Selling Pressure
When USDT.D reaches this level, it signals extreme selling pressure in the market, with panic selling peaking.
If USDT.D pulls back from this level, it suggests that investors are shifting back to risk assets and capital inflows into crypto have begun.
🔵 5.03% – The Level That Revitalizes the Market
A drop below 5.03% indicates that funds held in stablecoins are starting to flow into risk assets.
This is a positive signal for Bitcoin and the altcoin market.
If USDT.D continues to decline below this level and fails to hold, it strongly confirms that the market is entering a bullish trend.
🟢 4.68% – Accumulation Zone and Buyer Strength
This level has historically acted as a zone where sellers gained strength and the market consolidated.
Reaching 4.68% suggests that the market is in a recovery phase and large investors are accumulating assets.
Conclusion
USDT Dominance levels remain a key indicator for understanding capital flows and investor psychology in the market.
If USDT.D sustains levels below 6.06%, Bitcoin and altcoins are expected to gain bullish momentum.
Thus, investors should not only focus on price movements but also carefully track how liquidity is distributed across the market. TOTAL Market Cap Analysis: Key Levels and Possible Scenarios
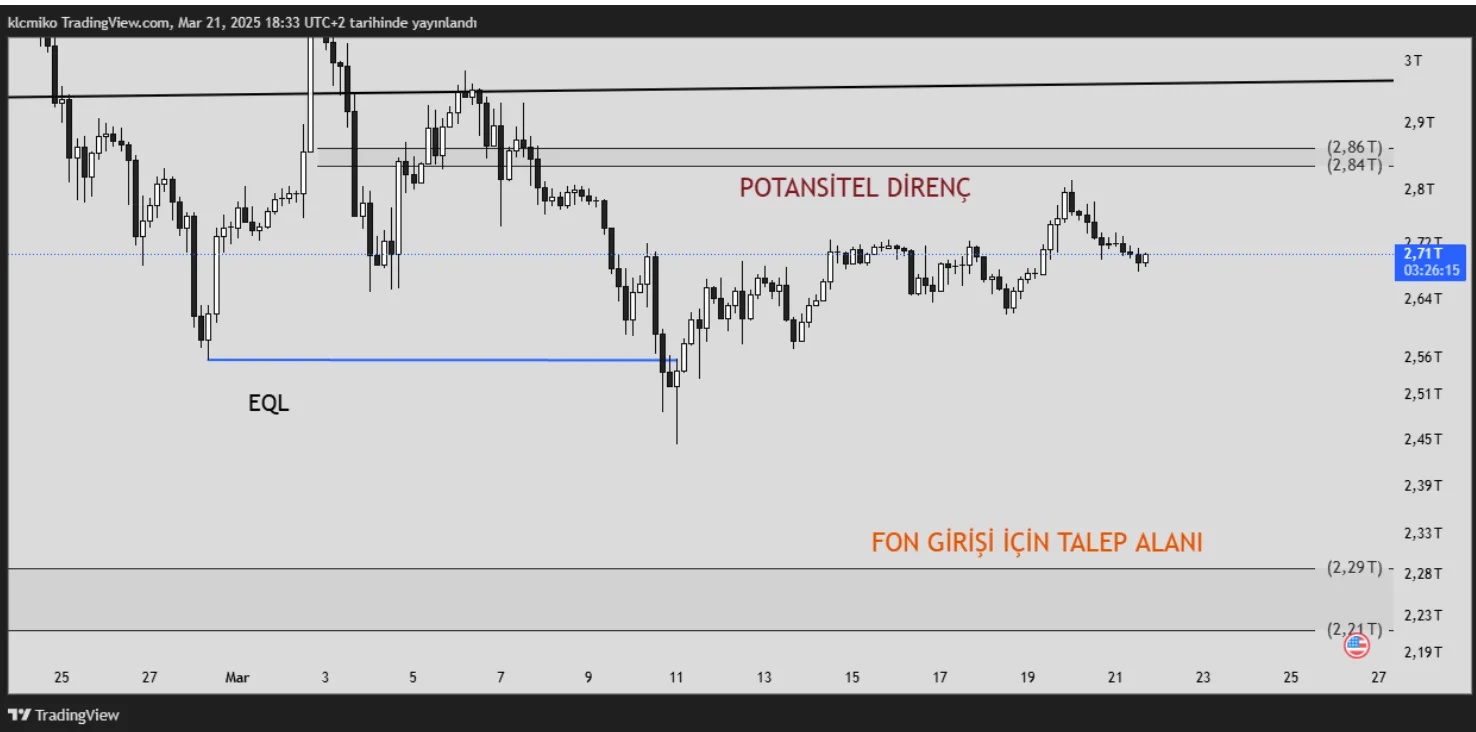
To understand the overall state of the cryptocurrency market, the TOTAL market cap serves as a crucial indicator. TOTAL’s movements at certain levels help assess market liquidity and investor confidence.
2.29T – Capital Inflow and Demand Zone
This level represents a strategic area where investors inject fresh capital into the market, increasing buying interest.
If TOTAL manages to hold this level, it suggests that confidence in the market remains intact.
However, losing this support may indicate that investors are becoming cautious and that the market is at risk of a deeper correction.
2.55T – Buyers' Strength Test
At this level, buyers are being tested. If they gain control, the uptrend could continue, with stronger resistance levels coming into focus.
On the other hand, if selling pressure increases, the price may retrace back to 2.29T. Therefore, it is crucial to closely monitor how this level holds.
2.84T – Key Resistance Level
This is one of the most critical resistance zones in the market.
If TOTAL breaks above this level with strong volume, a new uptrend could begin, paving the way for new highs in the crypto market.
However, if the price gets rejected here, it may head back to lower support levels, with a potential retest of 2.29T.
Conclusion
The way TOTAL market cap reacts at these levels remains a key indicator of the overall market health and direction.
✅ Holding above 2.29T increases the likelihood of maintaining positive momentum.
✅ Breaking 2.55T strengthens the bullish scenario.
✅ Surpassing 2.84T could open the door for new highs in the crypto market.
By closely monitoring these levels, investors can identify opportunities and potential risks in advance.