Bitcoin (BTC) and Ethereum (ETH) Technical Analysis: Key Levels and Market Direction
The cryptocurrency market continues to be shaped by the price movements of Bitcoin (BTC) and Ethereum (ETH) in particular. Currently, the market is moving around critical levels, with key support and resistance zones that will determine future price action in the coming days. So, which levels need to be broken for a bull market to begin? At which zones could the price reverse? Here’s our latest technical analysis!
Bitcoin (BTC): Key Levels for the Start of a Bull Market
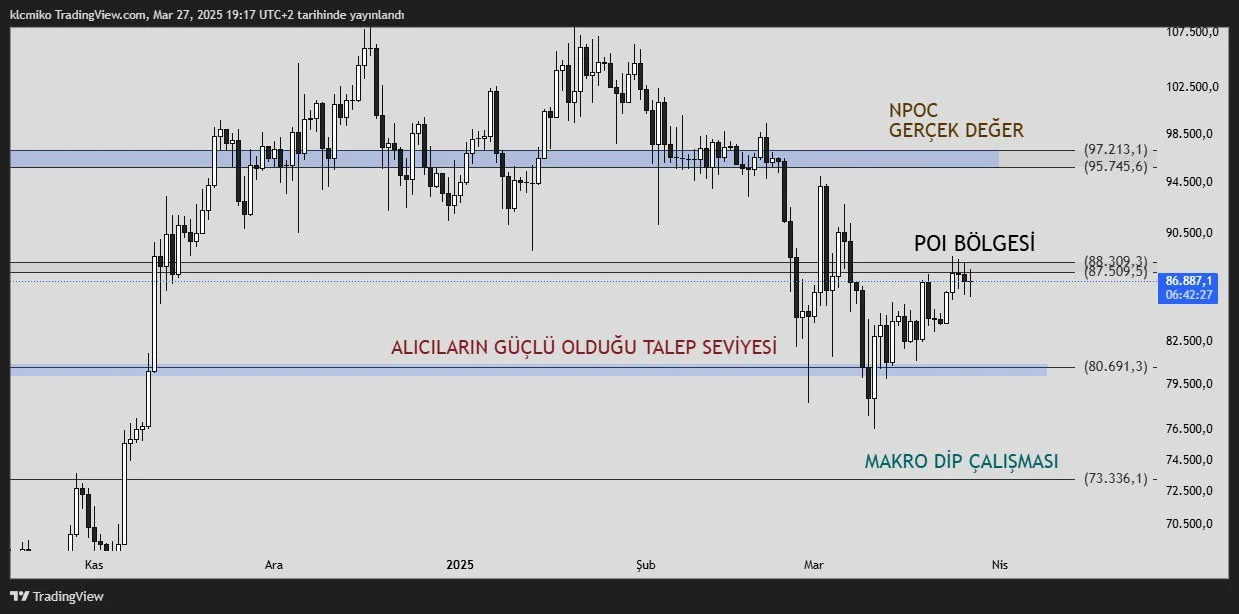
Bitcoin continues to receive strong buying interest around the $80,691 level. This area acts as a critical line of defense for BTC and has served as a strong support so far. If the price holds above this level, the likelihood of the bull trend continuing is quite high.However, if the $80,691 level is lost, selling pressure may increase, making a pullback toward the $73,336 area likely. This zone is one of the main turning points of the major uptrend that started from $15,500 for BTC, and any reaction from this level should be monitored closely. Let’s not forget that BTC previously initiated a 150% rally from the $73,336level.
Main Resistances Ahead for Bitcoin: How Far Can We Rise?
The most important resistance BTC will face on its upward moves is $87,500. This area is a critical zone, both as an SR Flip (Support-Resistance Flip) and a POI (Point of Interest).If BTC can break above the $87,500 level with strong volume, the price may move toward $92,591.A strong close above $92,591 is expected to push BTC into the $95,745 – $97,213 liquidity zone.Price action above $97,213 has the potential to carry BTC toward the $110,000 level.Breaking through these levels could open the door to new all-time highs and put the $130,000 target on the table.
Ethereum (ETH): The Keys to Upside and Target Levels
Ethereum is trading at important support and resistance zones that will define the market trend. For ETH to sustain its uptrend, it must defend specific areas and break through key levels.
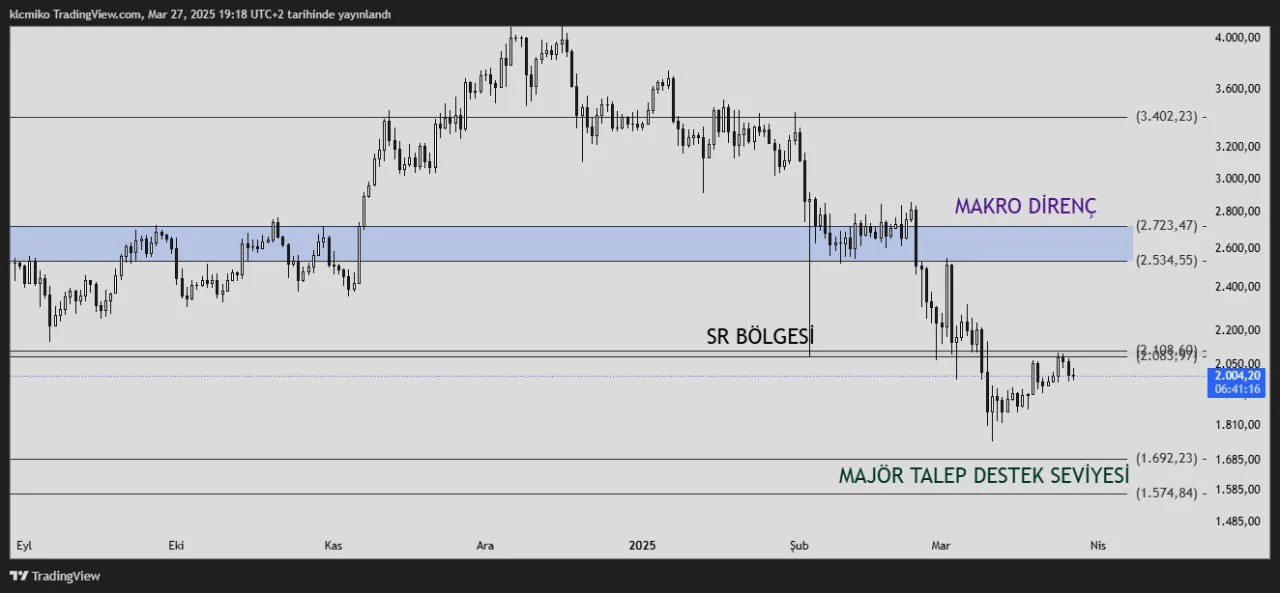
$1,692 – $1,574: Strong Demand ZoneAt these levels, ETH may attract institutional buying interest. If the price can hold above $1,692, a strong recovery movement can be expected.However, losing this support could increase selling pressure and pull the price down to $1,574. This zone will be a key defense line that will determine Ethereum’s trend.
$2,083 – $2,108: Resistance Flip Area (SR Flip)The first major barrier ahead of Ethereum is the $2,083 – $2,108 range.If ETH can break this zone with strong volume, upward momentum will accelerate.If it fails to stay above this zone, the price could return to lower support levels.The strength of buyers in this area will be one of the most crucial factors determining ETH’s trajectory.
$2,534 – $2,723: Major Resistance and Breakout ZoneThis level is a critical resistance zone where Ethereum could establish a new upper trend structure.If the price holds here and encounters strong buying interest, a new upward movement toward $3,402 could begin.However, if strong rejection occurs at this level, the price may be pulled back to lower support areas.
$3,402: Institutional Focus ZoneThis zone is carefully monitored by institutional investors. If ETH can maintain itself above $3,402, the $5,000 level may become inevitable.A strong breakout above this level could lead Ethereum into a price discovery phase, where new all-time highs may be tested.
$5,000 and the Layer 2 EffectIf Ethereum reaches the $5,000 level, it could lead to massive capital inflows into Layer 2 projects such as OP, STRK, ZKSYNC, and ARB. This would cause serious price movements in projects within the Ethereum ecosystem.
Key Levels That Will Determine Market Direction
- If Bitcoin loses the $80,691 support, $73,336 may be tested.
- If $87,500 is broken, it opens the door to $92,591, followed by $110,000.
- If Ethereum holds $1,692 – $1,574, a strong recovery could begin.
- A break above $2,083 – $2,108 could accelerate the uptrend.
- Sustained price action above $2,534 – $2,723 could lead to new highs.
- If $3,402 is broken, $5,000 becomes the next target.
In conclusion, the market's direction will depend on how the price behaves around these levels.
NASDAQ Technical Analysis and Market Direction
The NASDAQ (NDX) index, which has high correlation with Bitcoin, stands out as one of the key factors determining overall risk appetite in the market. Price movements in NASDAQ also send important signals for Bitcoin and other risk assets. Let’s now examine key support and resistance levels for NASDAQ.
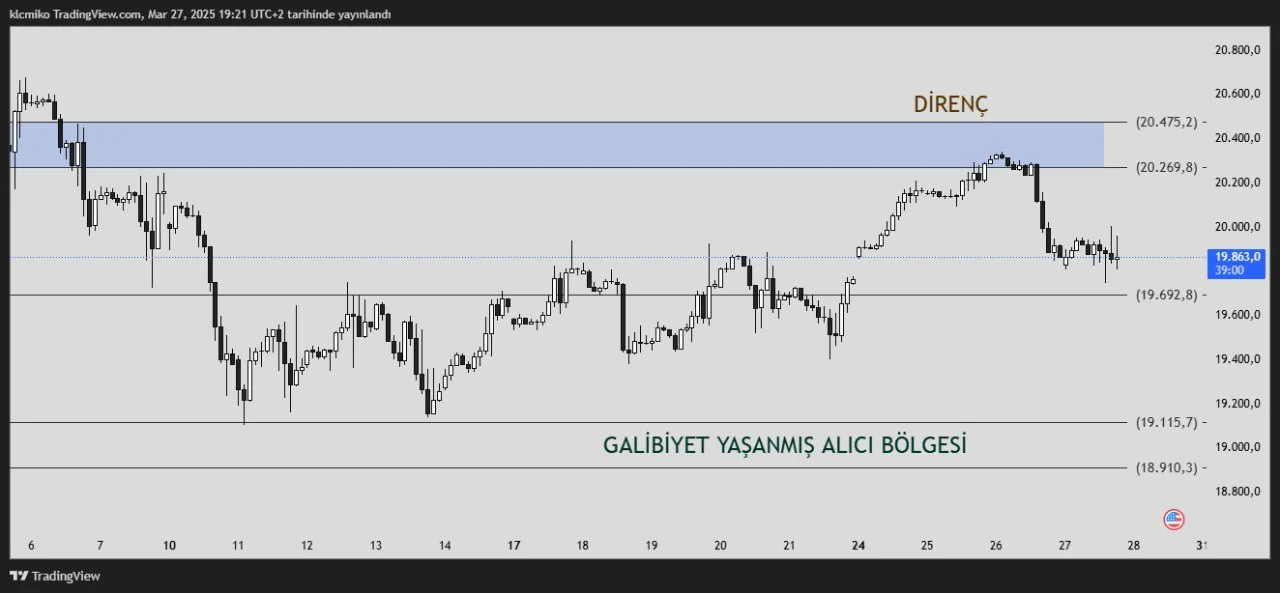
Short-Term Resistance Zone: 20,269 – 20,475This range should be followed as NASDAQ’s short-term resistance area.If the price sustains above 20,269 – 20,475, positive price movements are expected to continue.A strong breakout above this zone with volume could increase buyer appetite in NASDAQ and across the market.However, if strong selling emerges at these levels, short-term corrections may be seen.
Intermediate Support: 19,692The 19,692 level stands out as an important intermediate support for NASDAQ.Closing above this level is critical for the index to stay within its upward trend.If the price dips below this area, stronger support levels may be tested.However, if the level receives strong buying interest, an upward movement is expected to resume.
Major Support Zone: 19,115 – 18,910This area has been a region of strong buyer dominance for NASDAQ.If the price drops to this level and buyers regain control, it could act as a major support and initiate an upward reversal.If this area breaks, selling pressure may deepen and lower levels could be tested.
NASDAQ – Expectations
- If 20,269 – 20,475 is broken, the uptrend could strengthen.
- If 19,692 is maintained, the index is expected to remain positive.
- The 19,115 – 18,910 zone is where buyers tend to enter; losing this could trigger a larger market correction.
- NASDAQ’s reaction at these levels will be critical for determining the direction of Bitcoin and other risk assets. You can build your strategy by closely monitoring price action.
Disclaimer: These analyses do not constitute investment advice. They focus on support and resistance levels that may present trading opportunities in the short and medium term based on market conditions. However, trading and risk management decisions are solely the responsibility of the user. The use of stop-loss orders is strongly recommended.