
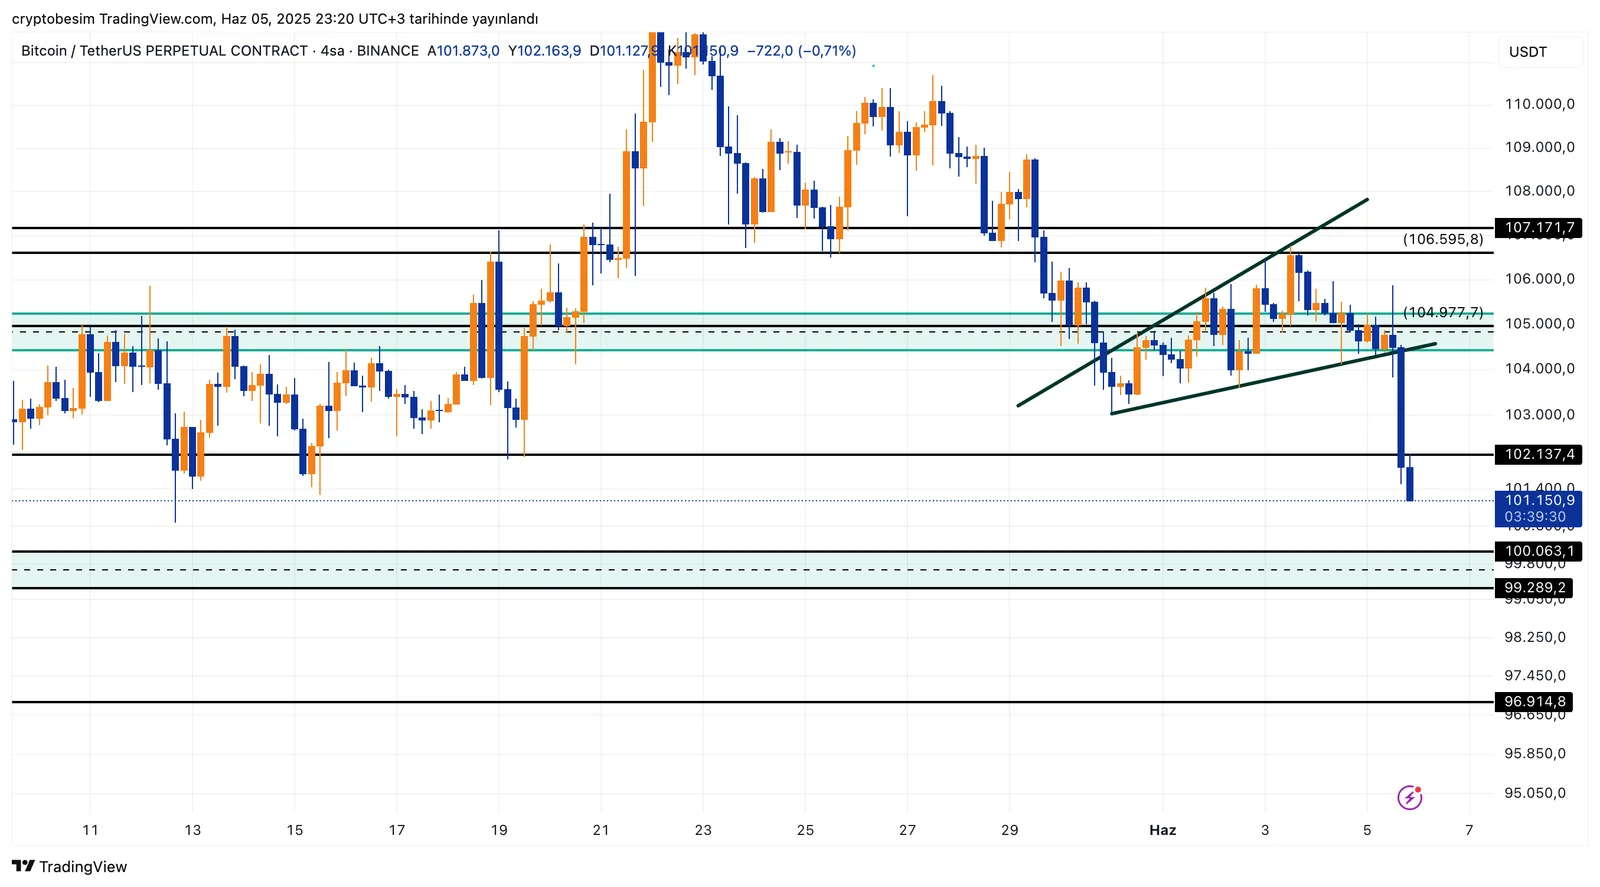
Bitcoin (BTC) Technical Analysis – 4-Hour Chart
Not Just Technicals—Political Factors at Play
The drop isn’t solely driven by technical indicators. A heated dispute between U.S. President Donald Trump and Elon Musk has shaken market sentiment. Trump referred to Musk as “crazy” and announced that government support for companies like Tesla and SpaceX would be cut off—indirectly impacting the crypto markets. Musk didn’t stay silent and openly responded to Trump. This back-and-forth has heightened uncertainty, especially among crypto investors.
What Does the Technical Picture Show?
Bitcoin is currently trading around $101,500. If it drops below this level, the $100,063–$99,289 range stands out as the first major support zone. This area has previously seen buying interest and upward price bounces.
If this zone also fails to hold, the next support lies at $96,914. In other words, the $100,000 psychological threshold is of critical importance—if it breaks, the decline could accelerate significantly.
On the other hand, in short-term recovery attempts, the $102,137 and particularly the $104,977 levels should be watched as resistance. Unless these areas are broken, any upward movement may remain weak and could be seen as selling opportunities.
In Summary:
- Bitcoin is currently under technical pressure.
- Unless there’s a close above $105,000, the downtrend seems likely to continue.
- $100,000 is a key psychological level—dropping below could trigger panic selling.
- Political developments will continue to influence price direction in the short term.
- There is no clear sign of recovery at this point, so investors should remain cautious and closely monitor both technical levels and news flow.


