
BTC Technical Analyses
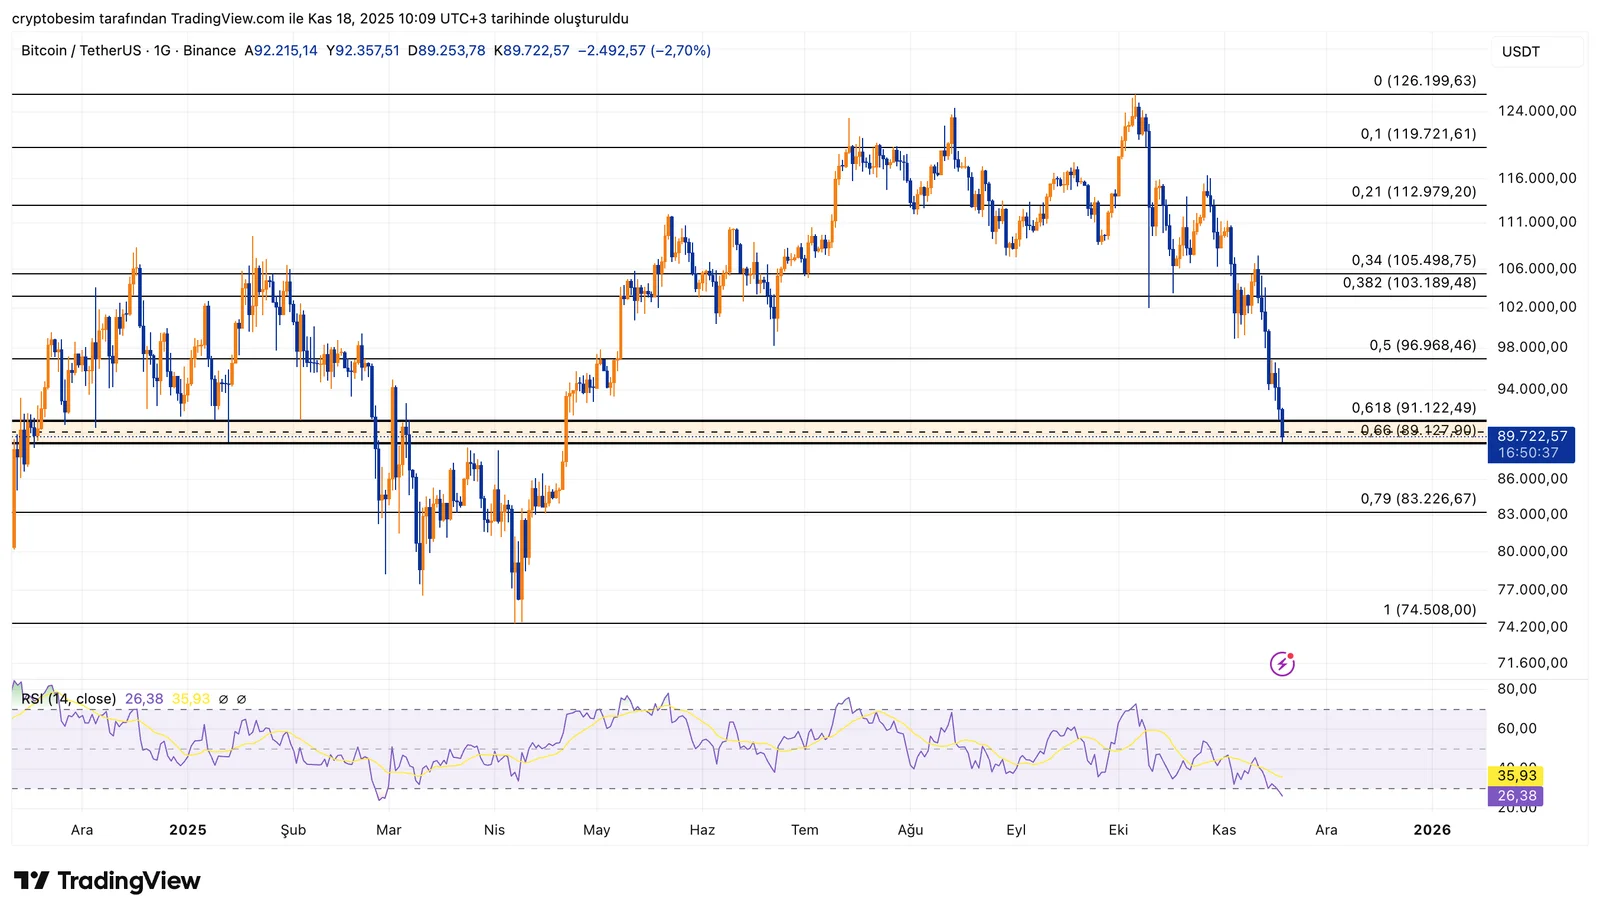
Analyzing the chart on the daily time frame, wee see that BTC has pulled back exactly into the expected zone on the daily chart. This zone refers to the 0.618–0.66 Fibonacci area. This zone has acted as a demand region in the past and often marks trend reversals. The price is currently trying to hold inside this band.
The RSI is also moving into the bottom zone, showing that selling pressure is weakening and momentum is fading. When we combine these signals, the current levels show a strong chance for a rebound.
Short-term outlook:
- As long as BTC holds above the 0.618 level ($91,100), the potential for a bounce remains strong.
- If a rebound begins, the first resistance zone is between $96,900 – $103,000.
- A break above this area would bring back bullish momentum.
If the price drops:
- The last possible retracement zone is between the 0.66 – 0.79 levels ($89,100 – $83,200).
- Even a test of the 0.79 level would not break the larger bullish structure.
In summary:
BTC is currently sitting in the “golden ratio” zone, where reversals often occur. A single strong green candle from this region would likely confirm a short-term recovery.
These analyses, not offering any kind of investment advice, focus on support and resistance levels considered to offer trading opportunities in the short and medium term according to the market conditions. However,traders are responsible for their own actions and risk management. Morover, it is highly recommended to use stop loss (SL) during trades.


