
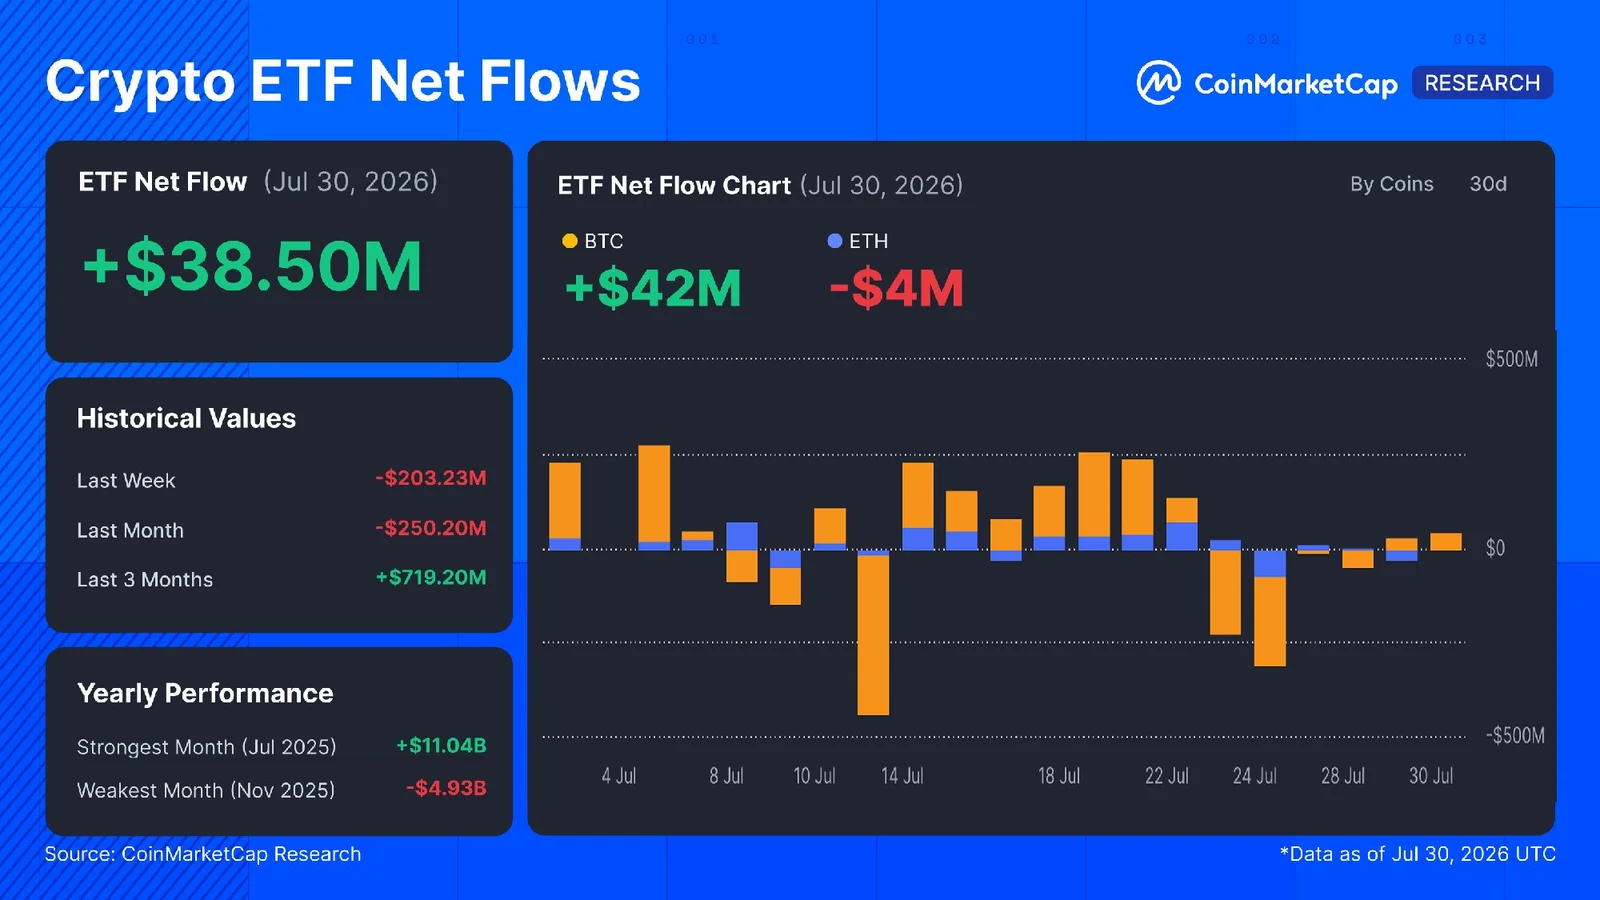
U.S.-listed spot crypto ETFs closed July 30 with $38.50 million in net inflows. According to CoinMarketCap Research, Bitcoin accounted for nearly all of that amount: BTC funds attracted $42 million, while Ethereum ETFs lost $4 million.
The figure may look small, but its timing matters. The broader picture throughout the month was far less encouraging.
Weekly flows remain in the red
Two trading days, July 23 and 24, shaped the entire month. Investors pulled $203.2 million from the funds on July 23. Bitcoin ETFs alone lost $226.6 million, while Ethereum funds recorded an unusual $23.4 million inflow.
The situation worsened the following day. Net outflows reached $310.8 million on July 24, with both Bitcoin and Ethereum funds losing capital. BTC ETFs shed $240.1 million, while ETH funds posted $70.7 million in outflows.
Investors withdrew a combined $514 million in just two days. Those losses pushed the 30-day flow down to negative $250.20 million and the weekly figure to negative $203.23 million.
In effect, two sessions erased nearly three weeks of recovery.
That is why the $38.5 million inflow recorded on July 30 requires a cautious reading. It stopped the bleeding, but weekly and monthly flows remain firmly in negative territory.
Whether this marks a one-day correction or the beginning of a reversal remains unclear. Crypto ETF markets have often returned to outflows after a single positive session, making cautious optimism the most reasonable stance for now.
The three-month picture tells a different story
The unusual part is that the three-month total remains positive at $719.20 million despite the weak short-term figures. Demand accumulated during May and June has absorbed much of July’s heavy outflows.
This supports a point frequently raised by market analysts. Daily ETF flows often reflect short-term positioning, while a broader window provides a clearer view of institutional demand.
Some analysts describe weekly fluctuations as “noise” and the three-month trend as the “signal.” That distinction carries particular importance for investors tracking institutional allocation decisions.
The best and worst months of the year
The extremes become even clearer in the annual data. July ranked as the strongest month of 2025, generating $11.04 billion in net inflows. November delivered the weakest result, with $4.93 billion leaving the funds.
The gap between those two months shows how quickly ETF flows can change direction. It also highlights how volatility remains a normal feature of the crypto investment market.
The positive session on July 30 offers some encouragement, but one day alone proves little. The next few trading days will provide a clearer answer.
If inflows continue, July could end with signs of a recovery. If they fade, the $514 million withdrawal on July 23 and 24 will remain the month’s defining story.
Market participants are now turning their attention to the first week of August.