
Bitcoin fell 4.8% in less than an hour on June 25, sliding from the $61,500 range to as low as $58,400. The decline was driven by a sell-off that started in technology stocks on U.S. exchanges and spilled over into the crypto market.
According to market data, Bitcoin opened the day at $59,524 before a sharp breakdown in the afternoon. The price quickly dropped to the $58,400 range, then recovered to around $59,400. At the time of writing, Bitcoin was trading at $59,422.
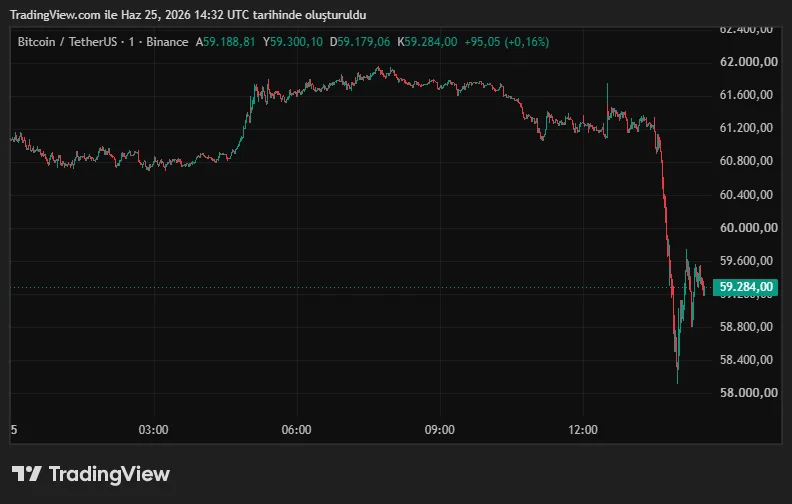
The speed of the move was striking. On the chart, the price had been moving calmly sideways in the $61,000-$61,600 range until around 16:00 TRT. Within the next hour, it turned into a steep red candle to the downside.
Liquidations Accelerated Quickly
During the sudden decline, five separate positions worth more than $10 million were liquidated. In total, nearly $560 million in positions were closed across the market in less than half an hour. Leveraged long positions triggered the next layer of liquidations as the price kept breaking lower, creating the classic setup traders call a “liquidation cascade.”
Bitcoin’s move below $59,000 marked the second major pullback of the month. The more striking detail is that Bitcoin fell below $59,000 for the first time since October 10, 2024. BTC has now lost more than half of its value since its October 2025 peak of $126,000.
The Main Trigger Came From Outside Crypto
According to some analysts, the drop was not driven by crypto-specific market dynamics. Instead, selling pressure from U.S. technology and semiconductor stocks spilled over from the previous day and weakened risk appetite more broadly. Bitcoin was caught in that wave. In recent months, when volatility rises in equities, Bitcoin has increasingly behaved less like a safe haven and more like a risk asset.
Outflows from spot Bitcoin ETFs are also making the picture heavier. The funds have recorded seven straight weeks of net outflows, pointing to weaker institutional demand. Strategy, formerly known as MicroStrategy, also sold Bitcoin for the first time in years during this period, reigniting debate over whether the company’s long-standing “never sell” stance is still as firm as it once was.
Key Levels Ahead
Analysts warn that a break below the $58,000 level could trigger a fresh wave of liquidations. According to Coinglass data, nearly $1.6 billion in additional long positions could be at risk if the price slips below that threshold.
On the technical side, analysts say the RSI indicator has entered oversold territory. Some investors see this as a possible reversal signal. Still, analysts remain cautious, noting that oversold conditions can last much longer than expected. Whether the market can hold the $58,000-$60,000 range in the coming days will likely determine the short-term direction.


