
ARB Technical Analysis
The governance side is discussing the use of billions of dollars worth of ARB in different investment and incentive programs to grow the ecosystem. This shows that Arbitrum’s growth strategy is continuing aggressively. However, how such a large supply will reflect on the market also creates uncertainty. Therefore, in the current price action, it is important to closely monitor how these decisions are being priced in.
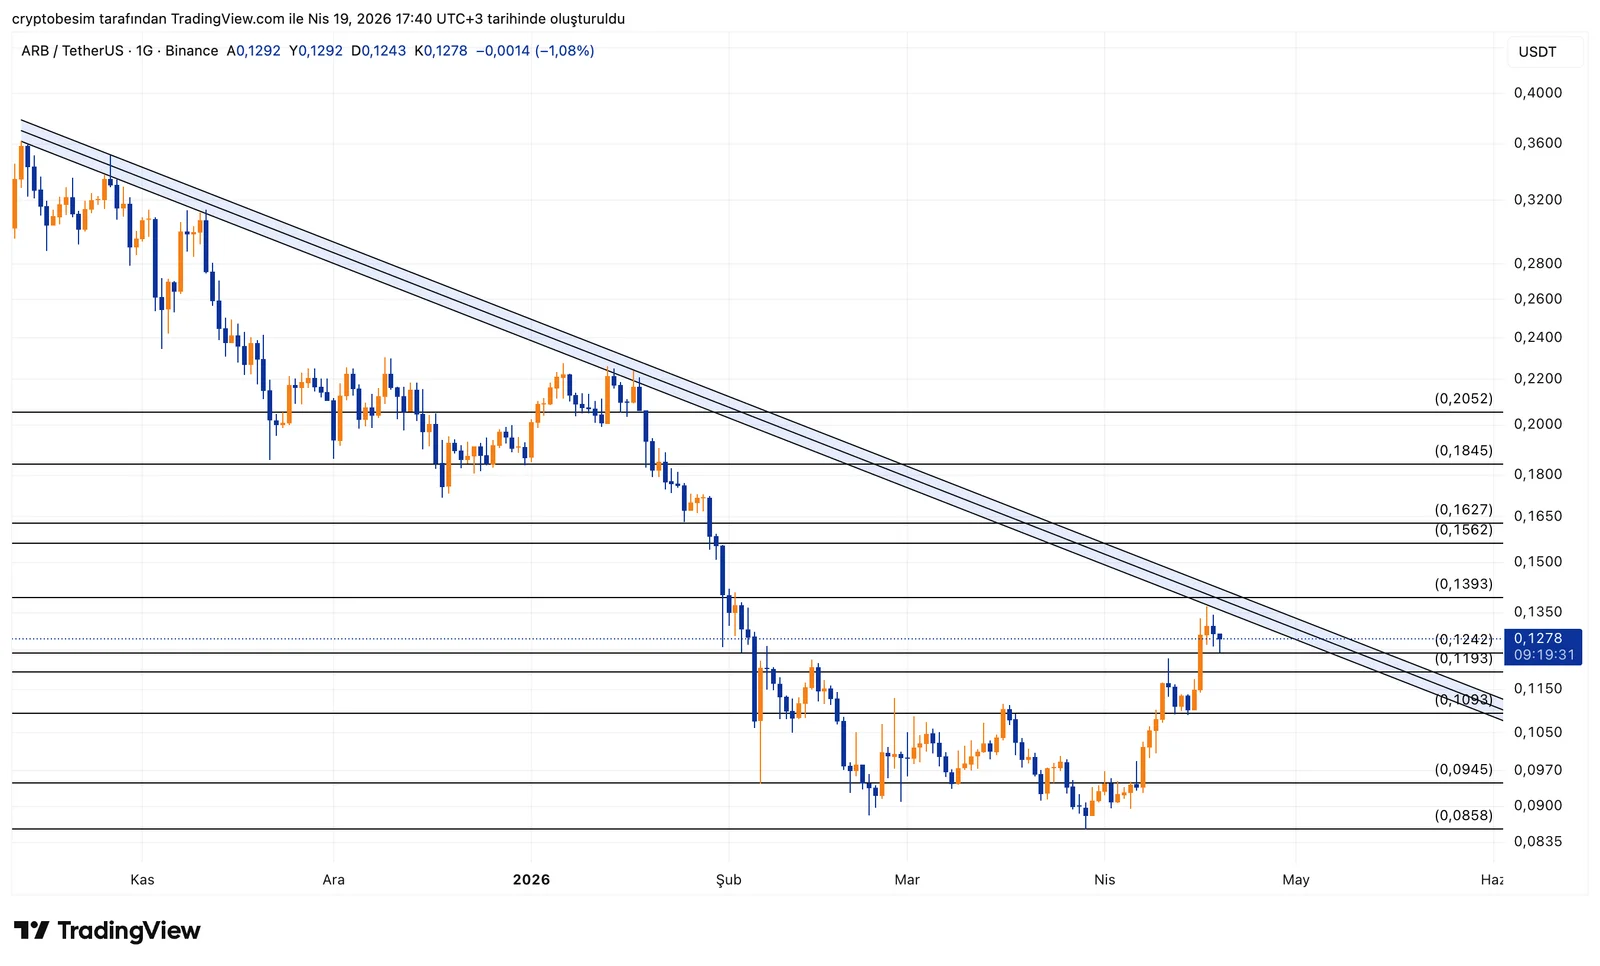
On the technical side, there is a clear downtrend, and price has reached the trendline resistance. Normally, the 0.16 level stands out as a major resistance, but price failed to reach that zone and got rejected directly from the trend resistance. So at this stage, the main resistance is not the horizontal level but the descending trend itself.
With the latest upward move, price reached the 0.12 range and faced resistance again. This shows that the trend is still actively working. Without a breakout, it is difficult to talk about a sustained upward move.
On the downside, the 0.119 – 0.109 range is acting as short-term support. If this area is lost, there is a risk of a pullback toward the 0.094 – 0.085 bottom range.
On the upside, the situation is clear: without breaking the descending trend, a strong rally is unlikely. If a breakout occurs, the first targets would be the 0.139 – 0.156 range, followed by the key 0.16 resistance.
Summary:
- Downtrend is the main determining factor
- 0.12 – 0.124 is the trend resistance
- No breakout → selling pressure continues
- 0.119 – 0.109 is short-term support
- Below this → pullback toward 0.094 – 0.085
- If trend breaks → 0.139 and 0.156 become targets
These analyses do not provide investment advice and focus on support and resistance levels that are considered to offer short- and medium-term trading opportunities depending on market conditions. However, responsibility for execution and risk management lies entirely with the user. In addition, the use of stop loss is strongly recommended.


