
ARB Technical Outlook
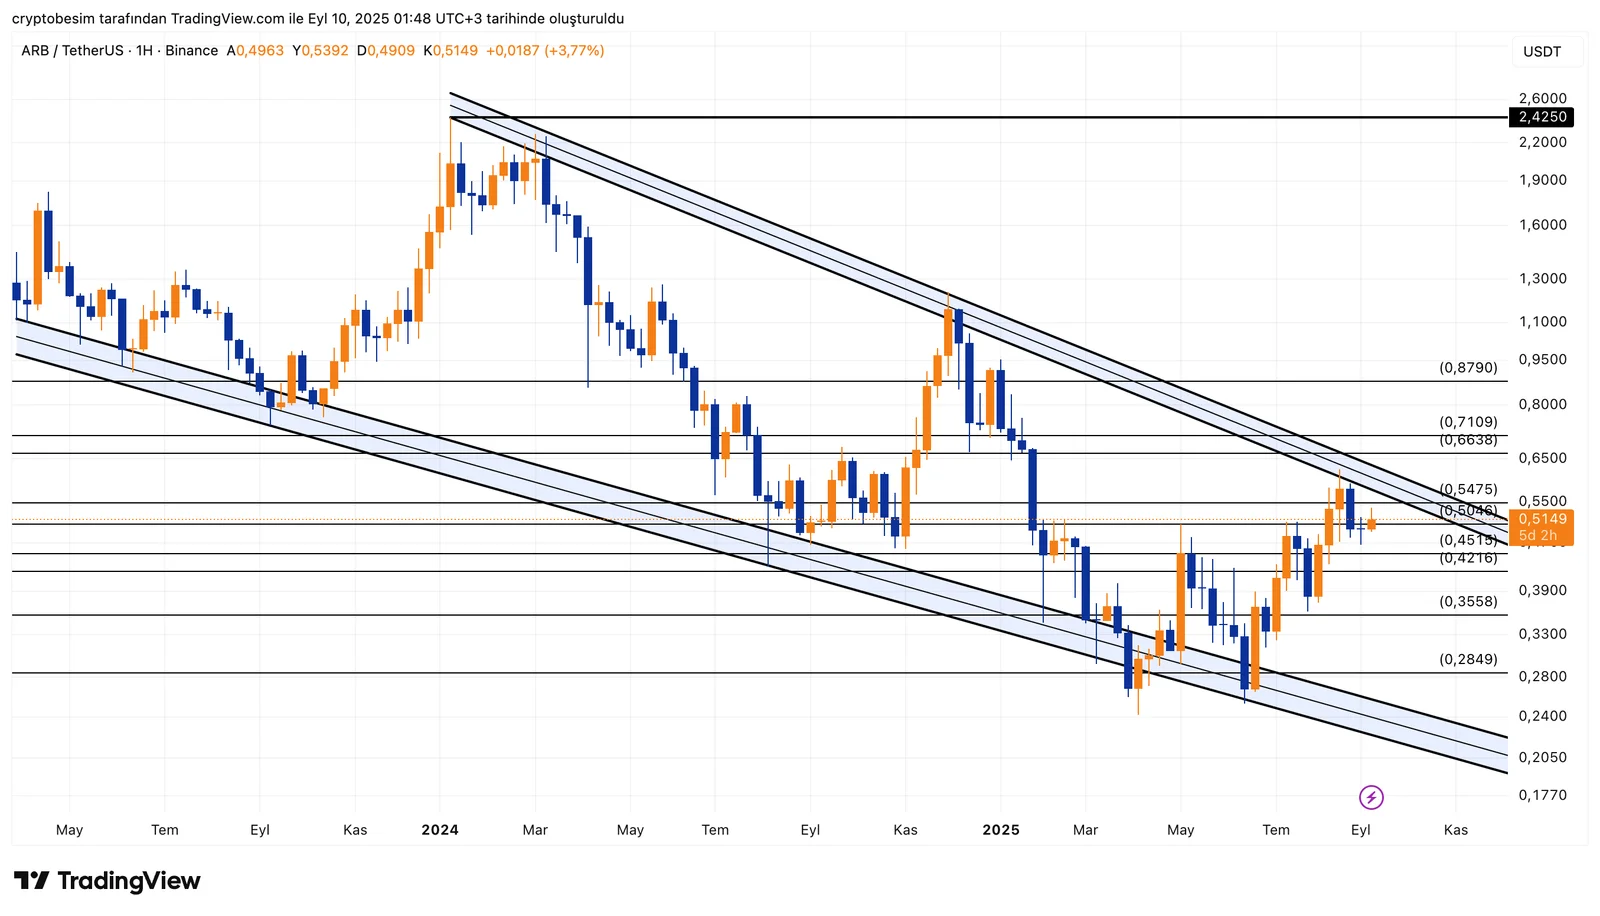
Analyzing ARB on a weekly time frame, we see that there is a quite wide falling wedge formation. The beginning of this wedge formation is too far to be seen even on a daily time frame, which suggests that the formation is a long-term pattern.
ARB is currently trading around the level $0.4950. The price of the coin has tried to climb above $0.4515 but it failed to hold there, leading to a pullback to the horizontal support levels. This zone is critical in terms of direction decision.The area between the levels $0.4515 and $0.5046 works as a short-term resistance. A daily breakout above the level $0.5046, in particular, would confirm the breakout of the falling wedge formation. In such case, the technical target of the formation, $2.4250, can be mentioned in the middle to long term.According to a bearish scenario, we should be following the levels at $0.3558, $0.3453 and the lower band of the formation $0.2849.
Summary:
- Formation: Long-term falling wedge
- Upward breakout target: $2.4250
- Short-term resistance levels: $0.4515 → $0.5046 → $0.5475
- Support levels: $0.3558 → $0.3453 → $0.2849
These analyses, not offering any kind of investment advice, focus on support and resistance levels considered to offer trading opportunities in the short and medium term according to the market conditions. However, the user is responsible for their own actions and risk management. Moreover, it is highly recommended to use stop loss (SL) during the transactions.


