
APT Technical Outlook
Aptos network is moving full speed ahead. The network’s total value locked (TVL) is close to hitting $1 billion, and institutions like BlackRock are showing growing interest in tokenizing real-world assets (RWA) on the Aptos blockchain. This makes APT not just another altcoin but a Layer-1 network gaining real institutional traction.
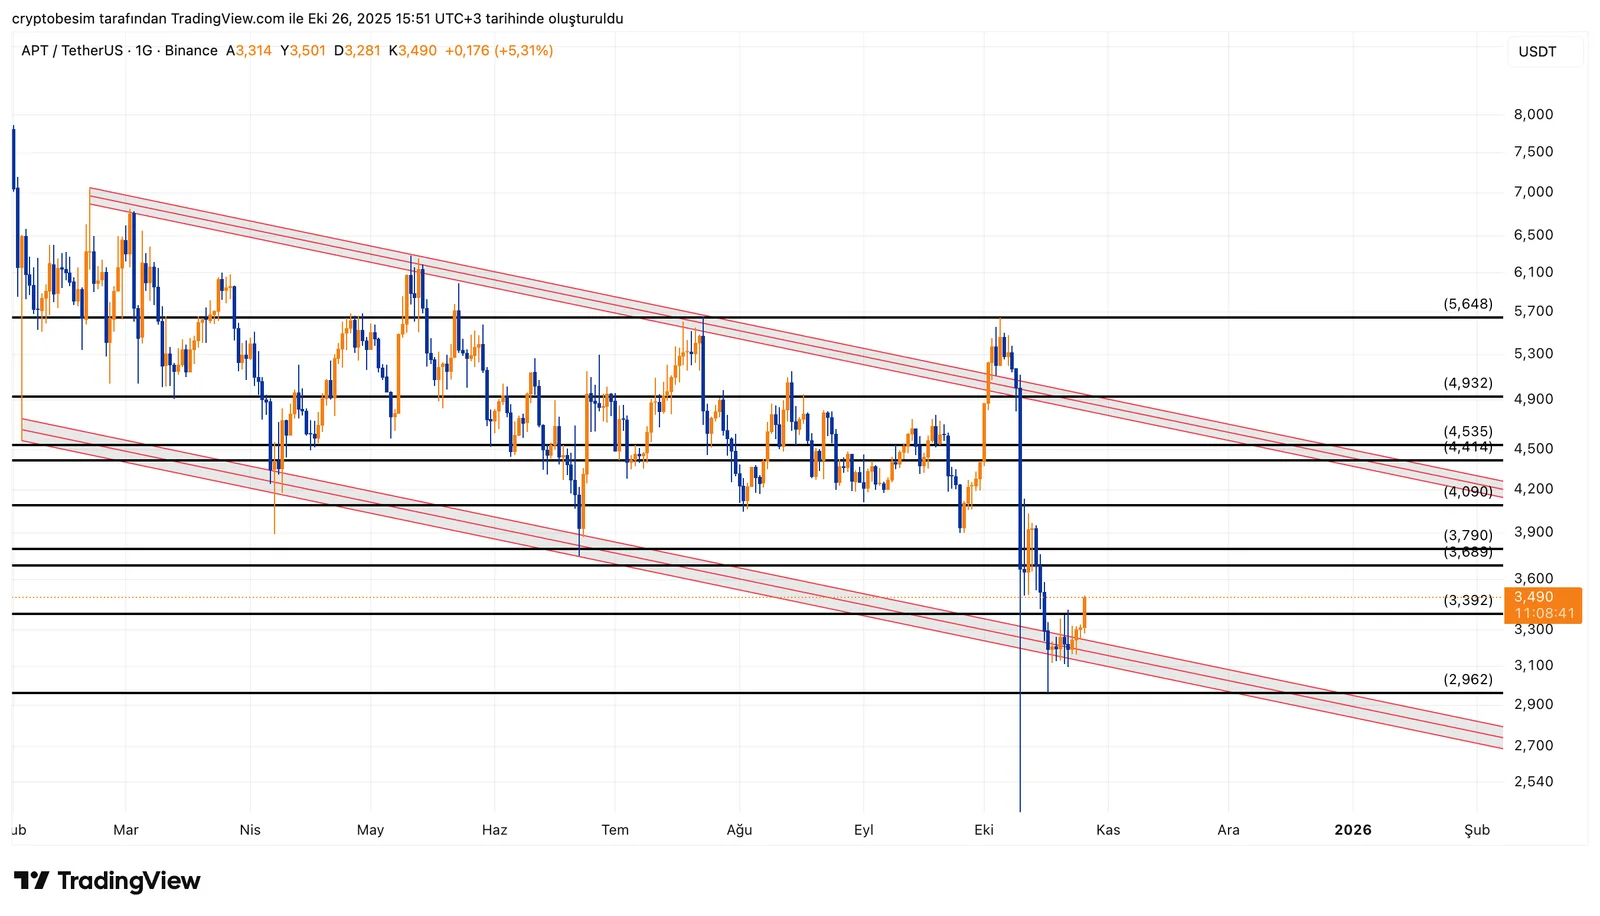
Analyzing the chart, we see that APT has been trading inside a descending channel for a long time. The price has recently bounced from the lower border of the channel and started to move upward again. The current price is around $3.49, showing early signs of recovery.
According to the channel structure, the short- to mid-term target is near $4.50, which lines up with both the upper channel resistance and a strong horizontal resistance zone; therefore, it’s likely to act as a major selling area. APT needs to break above the $3.68–$3.79 range for the bullish move to continue. A successful breakout could open the way toward $4.09–$4.35, and a clear move above $4.50 would confirm a trend reversal, targeting $4.93–$5.65 in the mid-term.
Note that $3.39 is the first key support level. Below that, $3.10 and $2.96 are the next supports. If the price closes below $2.96, it could lead to a deeper drop back toward the lower channel zone.
Support Levels: $3.39 → $3.10 → $2.96Resistance Levels: $3.79 → $4.09 → $4.50 → $4.93 → $5.65
Summary:
- APT is rebounding inside a falling channel.
- Above $3.79, the price could aim for $4.50 and higher.
- $4.50 is the key breakout level for trend reversal.
- Holding above $3.39 keeps the bullish setup alive; below $2.96, risk increases.
These analyses, not offering any kind of investment advice, focus on support and resistance levels considered to offer trading opportunities in the short and medium term according to the market conditions. However, traders are responsible for their own actions and risk management. Moreover, it is highly recommended to use stop loss (SL) during trades.


