ALT Comment and Price Analysis - September 9, 2025
ALT/USDT Technical Analysis
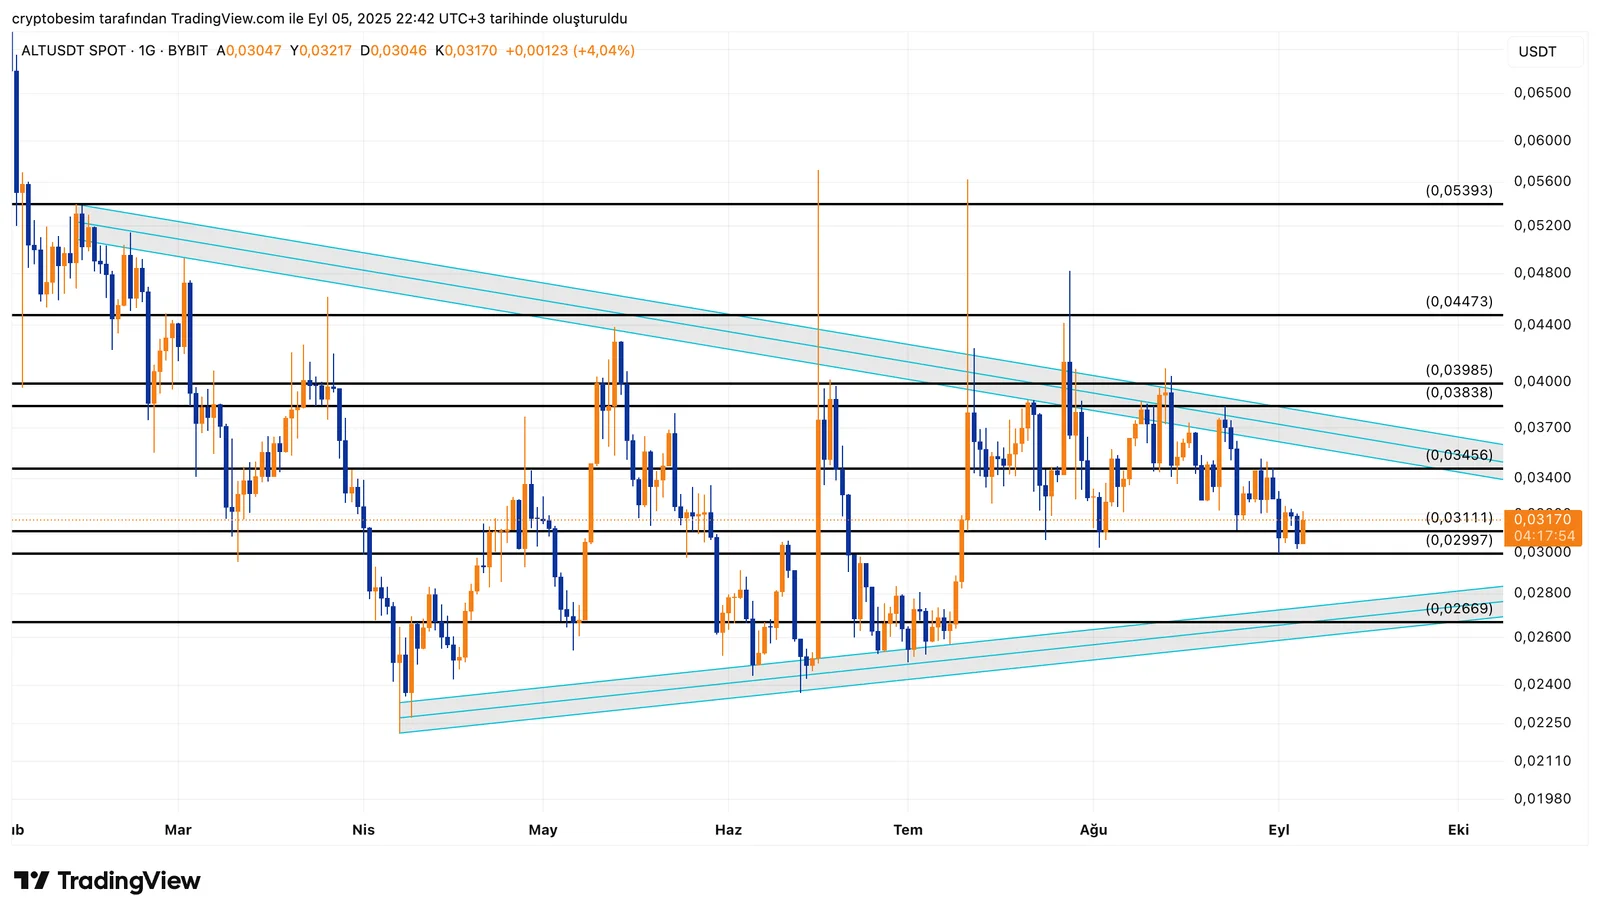
Narrowing Triangle Structure
Analyzing the ALT daily chart, we see that there is a narrowing triangle pattern standing. The price of the coin has approached the support zone between the levels $0.0311–$0.0299, which is considered very critical in the short term. The upper band of the triangle formation intersects with the resistance level $0.0345 and the horizontal resistance at $0.0383–$0.0398, which is the upper trendline of the formation.If we see a closing below the level $0.0299, then the formation becomes invalid and the price may pull back to the level $0.0266. However, the price is likely to attempt to go upward if the current pattern is maintained. The levels $0.0447 and then $0.0539 will become technical targets if the price manages to hold above the zone $0.0383–$0.0398 in particular.
Triangle formation keeps contracting, which signals that a breakout is on the way.
These analyses, not offering any kind of investment advice, focus on support and resistance levels considered to offer trading opportunities in the short and medium term according to the market conditions. However, the user is responsible for their own actions and risk management. Moreover, it is highly recommended to use stop loss (SL) during the transactions.