
XRP Technical Analysis
There is a critical threshold for XRP: a new venture backed by Ripple Labs is planning an IPO on Nasdaq with over a billion dollars in funding, and the main objective of this company is to acquire XRP tokens. This development has brought XRP back into the spotlight, especially on the institutional front.
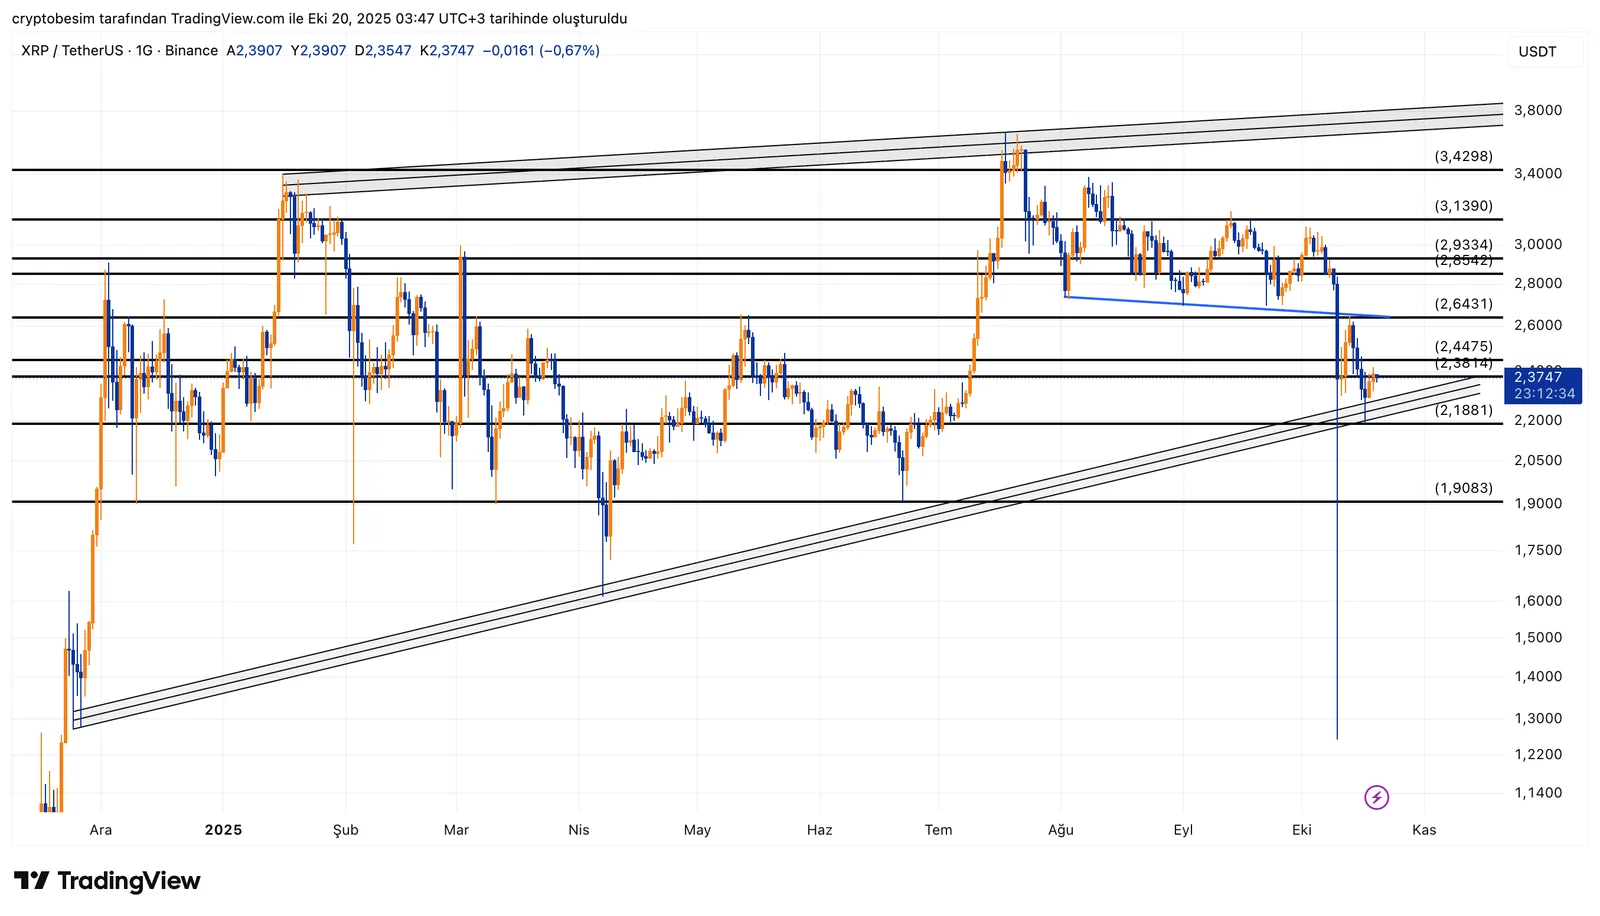
Analyzing the chart, we see that XRP still maintains its long-term upward trend structure. After a sharp decline, the price tested the trendline support and has started to recover. The current price is $2.37, which marks a key decision point.
The zone between $2.35 and $2.44 is significant, as it combines both trendline and horizontal support. As long as the price stays above this area, the outlook remains positive.
In a bullish scenario, the first resistance level is $2.64. If the price breaks above this level, the next targets are $2.85 and $2.93. With continued momentum, the price could move toward $3.13 and $3.42 in the medium term.
In a bearish scenario, a daily close below $2.35 could accelerate the correction toward $2.18, with the potential to retest the $1.90 zone — a major long-term support area.
Summary:
- XRP is still holding its primary upward trend.
- Key support zone: $2.35–$2.44.
- Resistance levels: $2.64 → $2.85 → $2.93 → $3.13 → $3.42.
- Staying above $2.35 keeps the trend bullish.
- A break below $2.35 could lead to a drop toward $2.18 or even $1.90.
These analyses, not offering any kind of investment advice, focus on support and resistance levels considered to offer trading opportunities in the short and medium term according to the market conditions. However, traders are responsible for their own actions and risk management. Moreover, it is highly recommended to use stop loss (SL) during trades.


