
XRP Technical Analysis
Nasdaq’s recent signal of approval for a potential spot XRP ETF could mark the beginning of a new chapter for the asset. This move may make it easier for institutional investors to access XRP, increasing both market interest and liquidity. After years of regulatory challenges, the news has created optimism across the sector, drawing investors’ attention back to XRP’s price action.
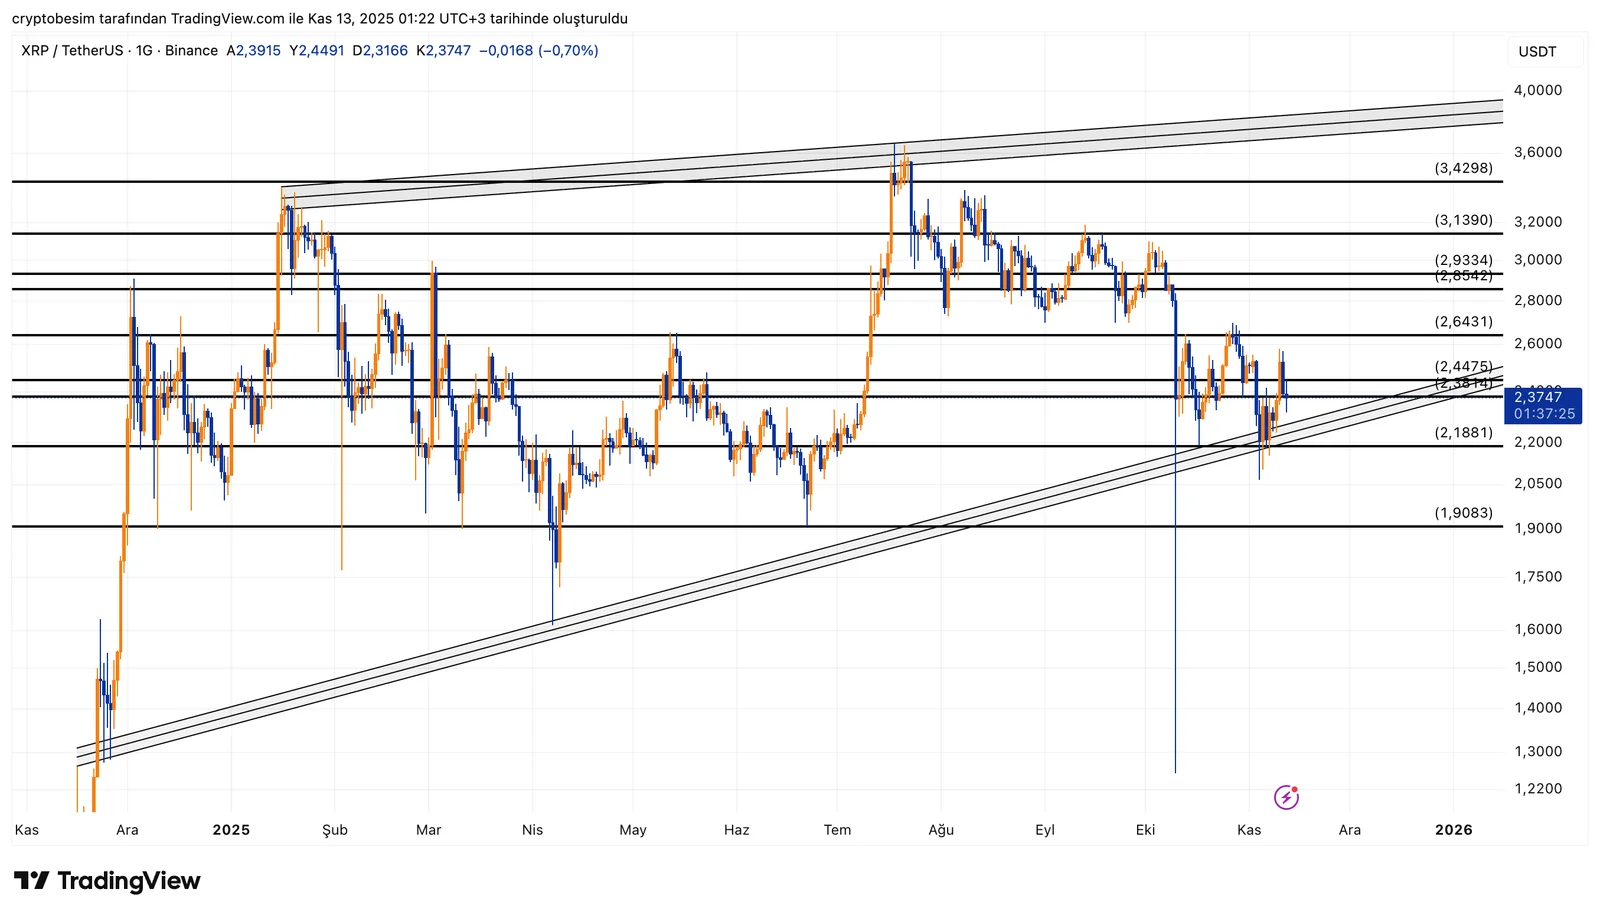
Analayzing the chart, we see that XRP has technically returned to its ascending channel, giving a positive signal on the charts. Following a sharp drop at the end of October, the price found solid support around $2.18, bouncing from this level and reclaiming both the rising trendline and the lower boundary of the channel.
XRP is currently trading around $2.37, which acts as a short-term resistance and trend confirmation zone. A sustained move above this level could open the door for a push toward the $2.45 – $2.64 range. This zone previously attracted strong selling pressure.
The next potential targets lie at $3.13 and $3.42 if the upward channel remains intact. However, if the price closes back below $2.45, a pullback toward $2.18 support becomes likely. Holding this key level will be essential to maintain the overall bullish structure.
Summary
- The trend remains positive within the rising channel.
- $2.18 is the main support, and $2.45 is the short-term resistance.
- A clear breakout above $2.45 could lead to a move toward $2.64 – $3.13.
- Keeping the channel structure intact is crucial for the bullish outlook to continue.
These analyses, not offering any kind of investment advice, focus on support and resistance levels considered to offer trading opportunities in the short and medium term according to the market conditions. However, the user is responsible for their own actions and risk management. Morover, it is highly recommended to use stop loss (SL) during the transactions.


