UNI/USDT Technical Outlook
The project team has put forward the long-discussed new governance and fee model proposal called “UNIfication.” This proposal aims to direct a portion of transaction fees toward UNI burn, reducing token supply and thereby capturing value. After this news, strong reactions were seen in the UNI price and trading volume increased, indicating that investors still care about the future of Uniswap.
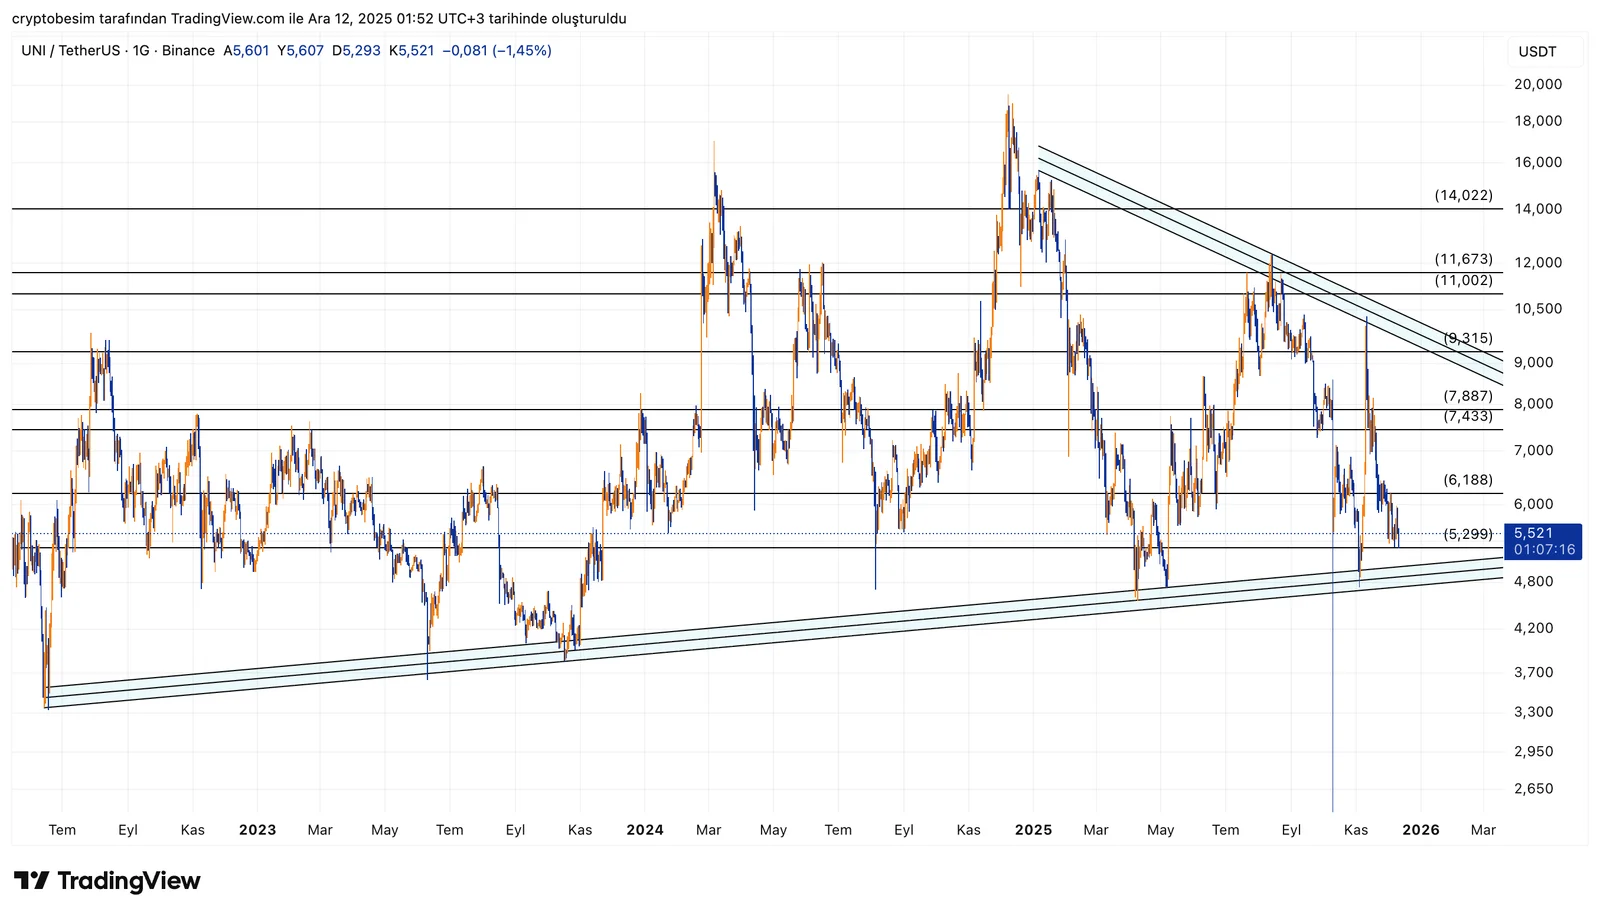
UNI’s long-term chart points to a very clear structure: There is a strong ascending main trend coming from below, and this trend has acted as the main backbone supporting the price for years. On the upper side, a shorter-term descending trend continues to put pressure on the price. The intersection of these two structures has formed a distinct symmetrical triangle formation on the chart.
The price is currently trying to hold in the 5.30–5.50 region, which is the lower band of the triangle. Since this is both a horizontal support and the area where the long-term ascending trend line passes through, it is critical. As long as this region is preserved, a medium-term upward attempt from UNI is highly likely. As the first target, 6.18 and then the 7.43–7.88 band come forward.
The descending trend above has strengthened with three separate touches. This trend pressure will continue until the price breaks upward. The upper boundary of the triangle corresponds regionally to the 9.30–9.70 range, and this is the main breakout area for UNI in the big picture. If this region is surpassed, the long-term uptrend can gain broad momentum.
These analyses, which do not provide investment advice, focus on support and resistance levels that are thought to create short- and medium-term trading opportunities depending on market conditions. However, the responsibility for trading and risk management belongs entirely to the user. In addition, it is strongly recommended to use stop loss for the positions shared.


