
TIA/USDT Technical Analysis
Analyzing TIA on a daily time frame, we see that downtrend pressure still persists. The price has recently bounced a little with the help of the support from the level at $1.60, yet it still remains within the downtrend. TIA is currently trading around the level $1.61.We have the critical resistance zone between the levels $1.81–$1.88 in the short term. Unfortunately, each attempt to break above this resistance zone has faced selling pressure so far. $2.11, in particular, will be the key level to determine the direction of the trend in the middle term. In the event that the price manages to hold above this key level, the possible targets could go as far as $2.36 → $2.45 → $2.78 → $3.40.According to a bearish scenario, the price could test the first support level $1.60. Below it, other possible support levels to follow are $1.43 and $1.31, which is the most critical level, as losing it could break the medium-term structure.To summarize, we can say that a break and hold above $2.11 would signal a stronger uptrend, while losing $1.31 could increase downside risk.
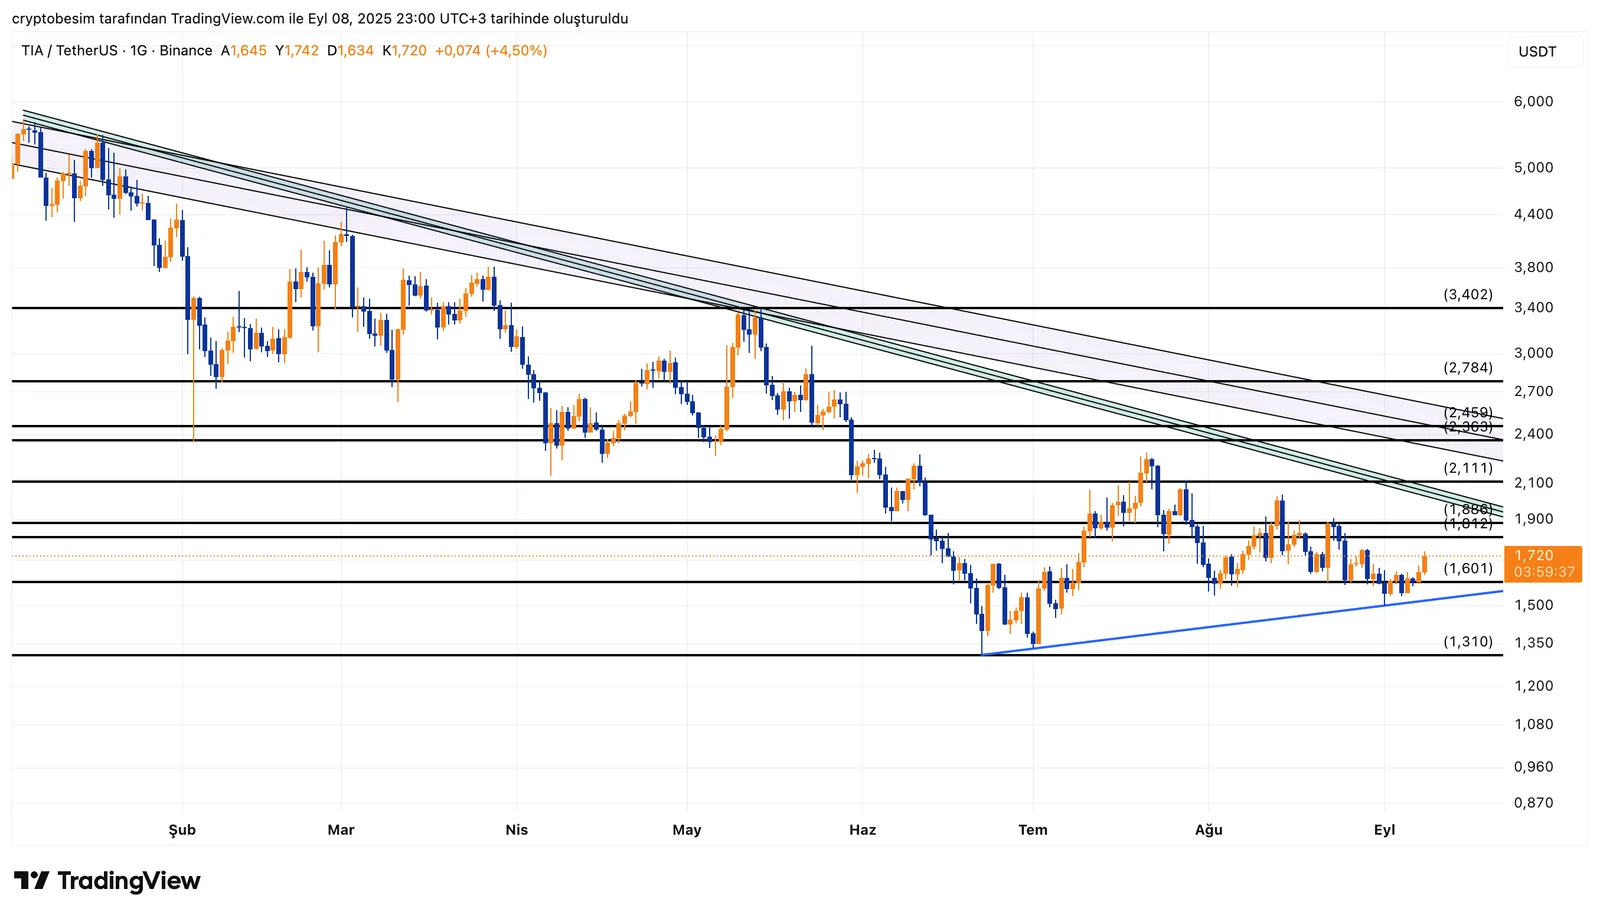
Levels to follow
- Resistance levels: $1.81–$1.88 → $2.11 → $2.36 → $2.45 → $2.78 → $3.40
- Support levels: $1.60 → $1.43 → $1.31
These analyses, not offering any kind of investment advice, focus on support and resistance levels considered to offer trading opportunities in the short and medium term according to the market conditions. However, the user is responsible for their own actions and risk management. Moreover, it is highly recommended to use stop loss (SL) during the transactions.


