TIA/USDT Technical Analysis
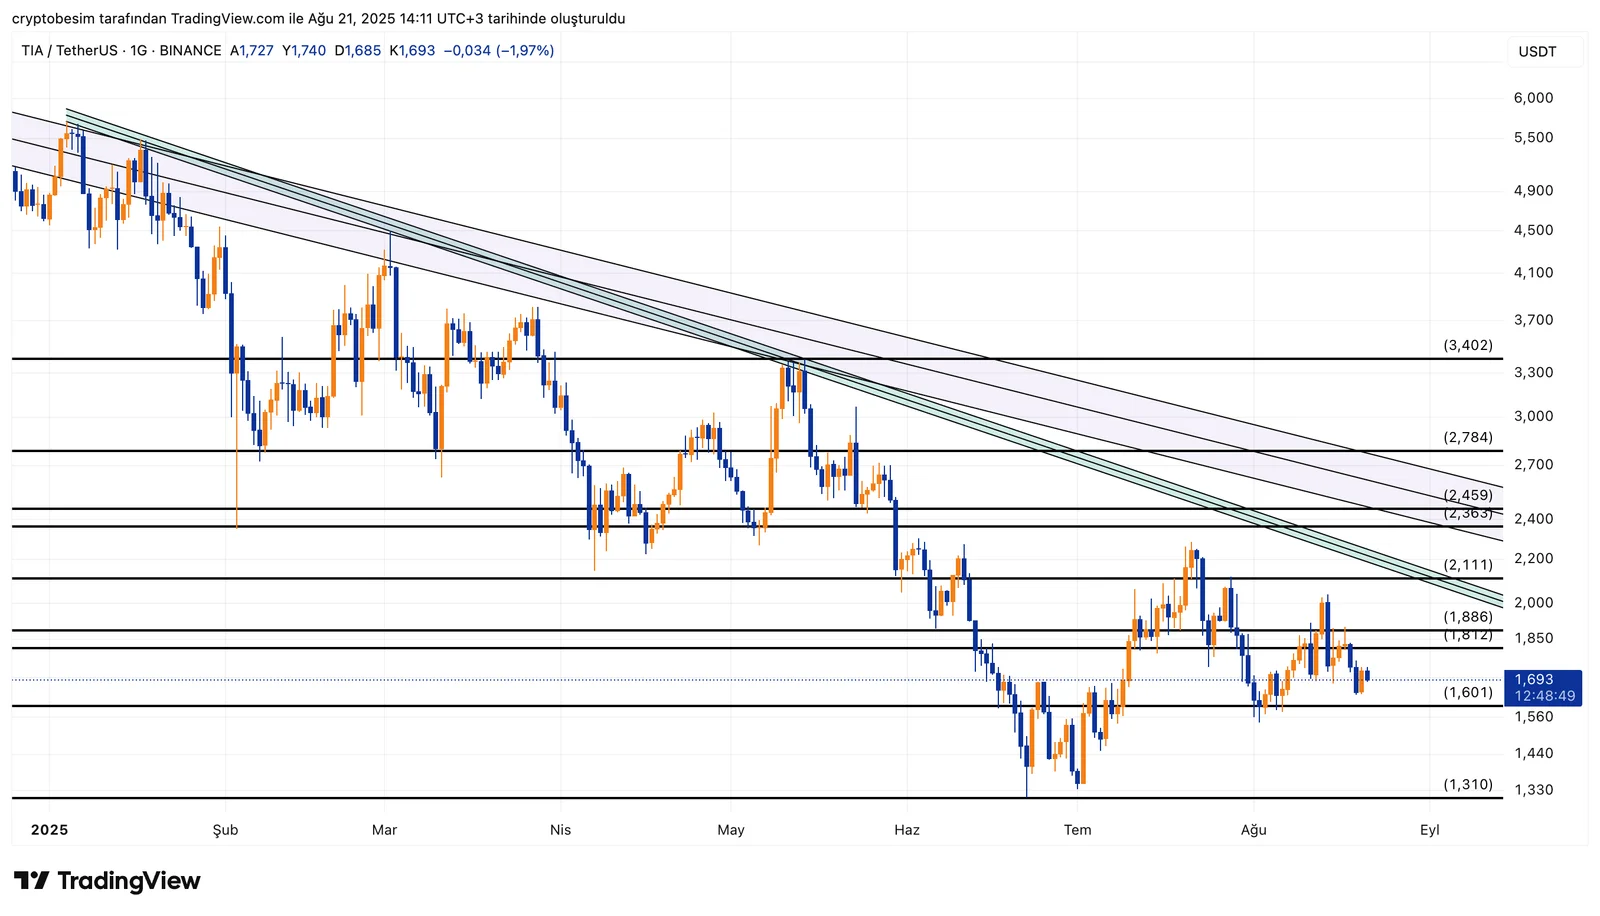
Analyzing TIA chart, we see that downtrend is still dominant. The price of the coin tested $2.11 and then got rejected from that level. It is currently trading around the level at $1.69. This general outlook indicates that buyers are not strong enough in the short term.It is clear that the range between the levels $1.81 – $1.88 has turned into a resistance. If this resistance gets broken, the next key level will be $2.11. If TIA can hold above this key level, it is possible that the levels at $2.36 → $2.45 and $2.78 will be the next upper targets ahead.We have the first support level at $1.60 in case of a pullback. Below this level, we should be following the critical levels at $1.43 and $1.31.

Summary:
- Resistance zones: $1.81 – $1.88 → $2.11 → $2.36 → $2.45 → $2.78
- Support zones: $1.60 → $1.43 → $1.31
These analyses, not offering any kind of investment advice, focus on support and resistance levels considered to offer trading opportunities in the short and medium term according to the market conditions. However, traders are responsible for their own actions and risk management. Moreover, it is highly recommended to use stop loss (SL) during trades.


