TAO Commentary and Price Analysis - September 10, 2025
TAO/USDT Technical Analysis
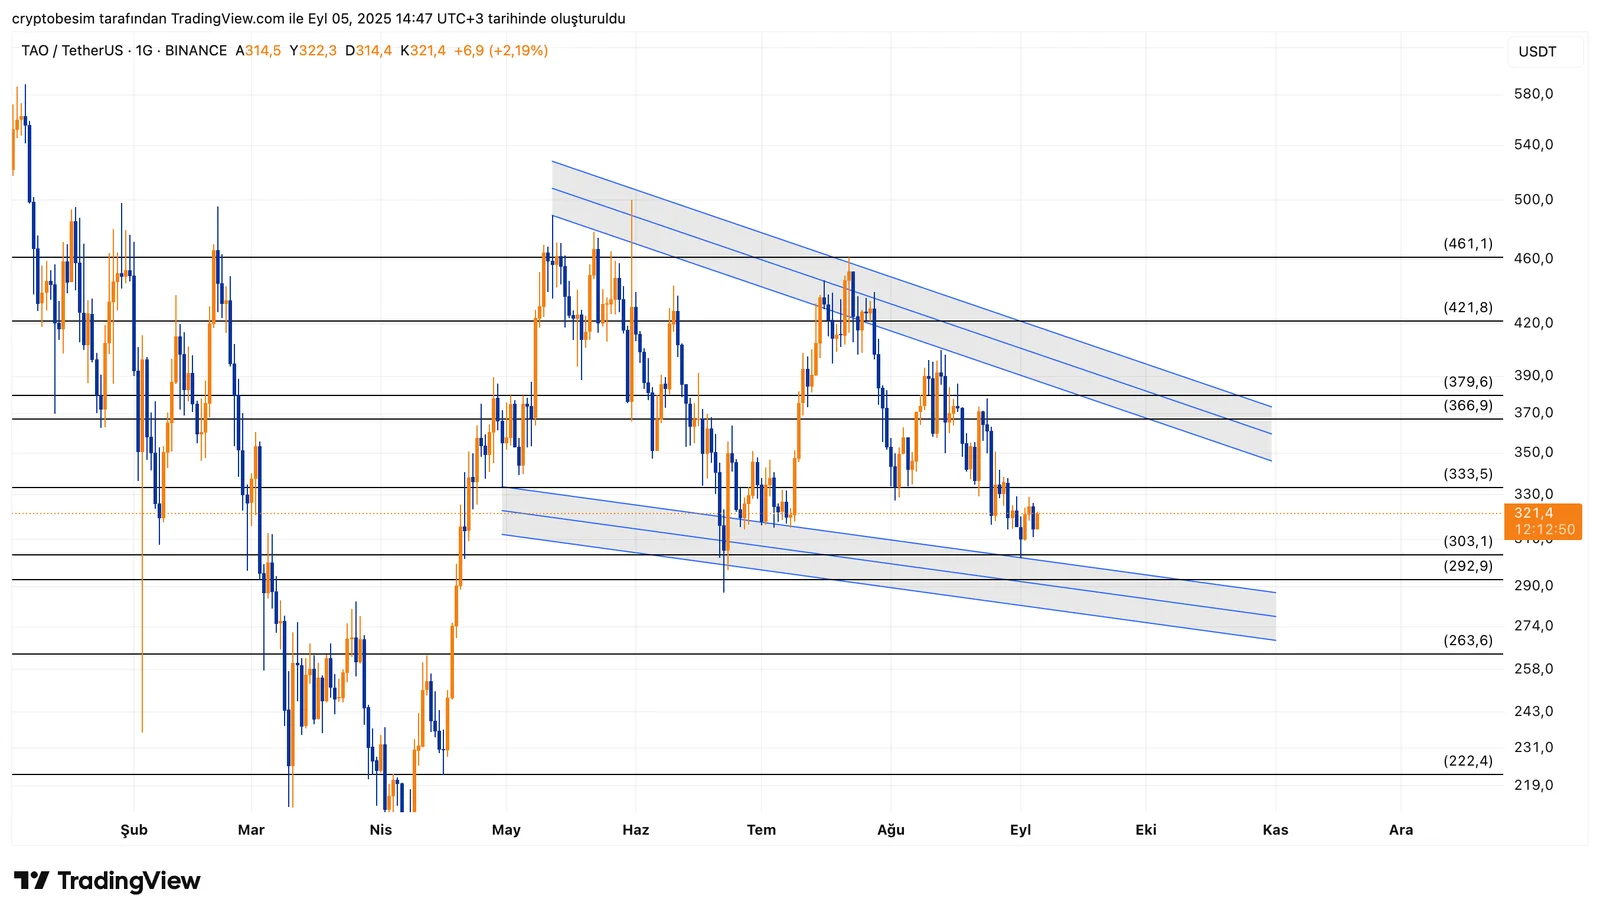
Falling Wedge Structure with Wide Trend
According to the TAO chart on a daily time frame, there seems to be a clear falling wedge formation which is taking shape properly though the trend lines are spread across a wider range. We presume that TAO could go up toward the upper border of the formation, bouncing from the wedge’s lower border.The range between the levels $292–$303 stands as a strong resistance. This area also overlaps with the lower band of the wedge; therefore, it is highly probable that TAO will reverse from here. On the other hand, daily price closings below $263 will possibly signal a bearish breakdown of the formation.According to a bullish scenario, TAO will see the first resistance at the level $333. Above this resistance, we have other key decision areas at $366–$379. If the price manages to reach this key decision zone, we can consider that the price has touched the upper trend line above. If we see a breakout above the level at $400, this move could speed up the bullish momentum.According to this scenario, the other target levels to follow are $421 → $461 → $500 → $580.
Key levels to follow:
Support levels: $303 → $292 → $263 (breakdown risk)
These analyses, not offering any kind of investment advice, focus on support and resistance levels considered to offer trading opportunities in the short and medium term according to the market conditions. However, the user is responsible for their own actions and risk management. Moreover, it is highly recommended to use stop loss (SL) during the transactions.