
SUI Technical Analysis
On the SUI side, the most notable recent developments have been CME preparing to launch SUI futures and the Sui Foundation’s strategic investment in Splyce Finance. The futures product is seen as an important step that could increase institutional access. The Splyce investment aims to strengthen Sui’s cross-chain connectivity and accelerate growth on the DeFi side. These developments show that interest in SUI is being supported not only by expectations but also by concrete ecosystem progress. The sustainability of the recent price move will partly depend on the impact of these developments.
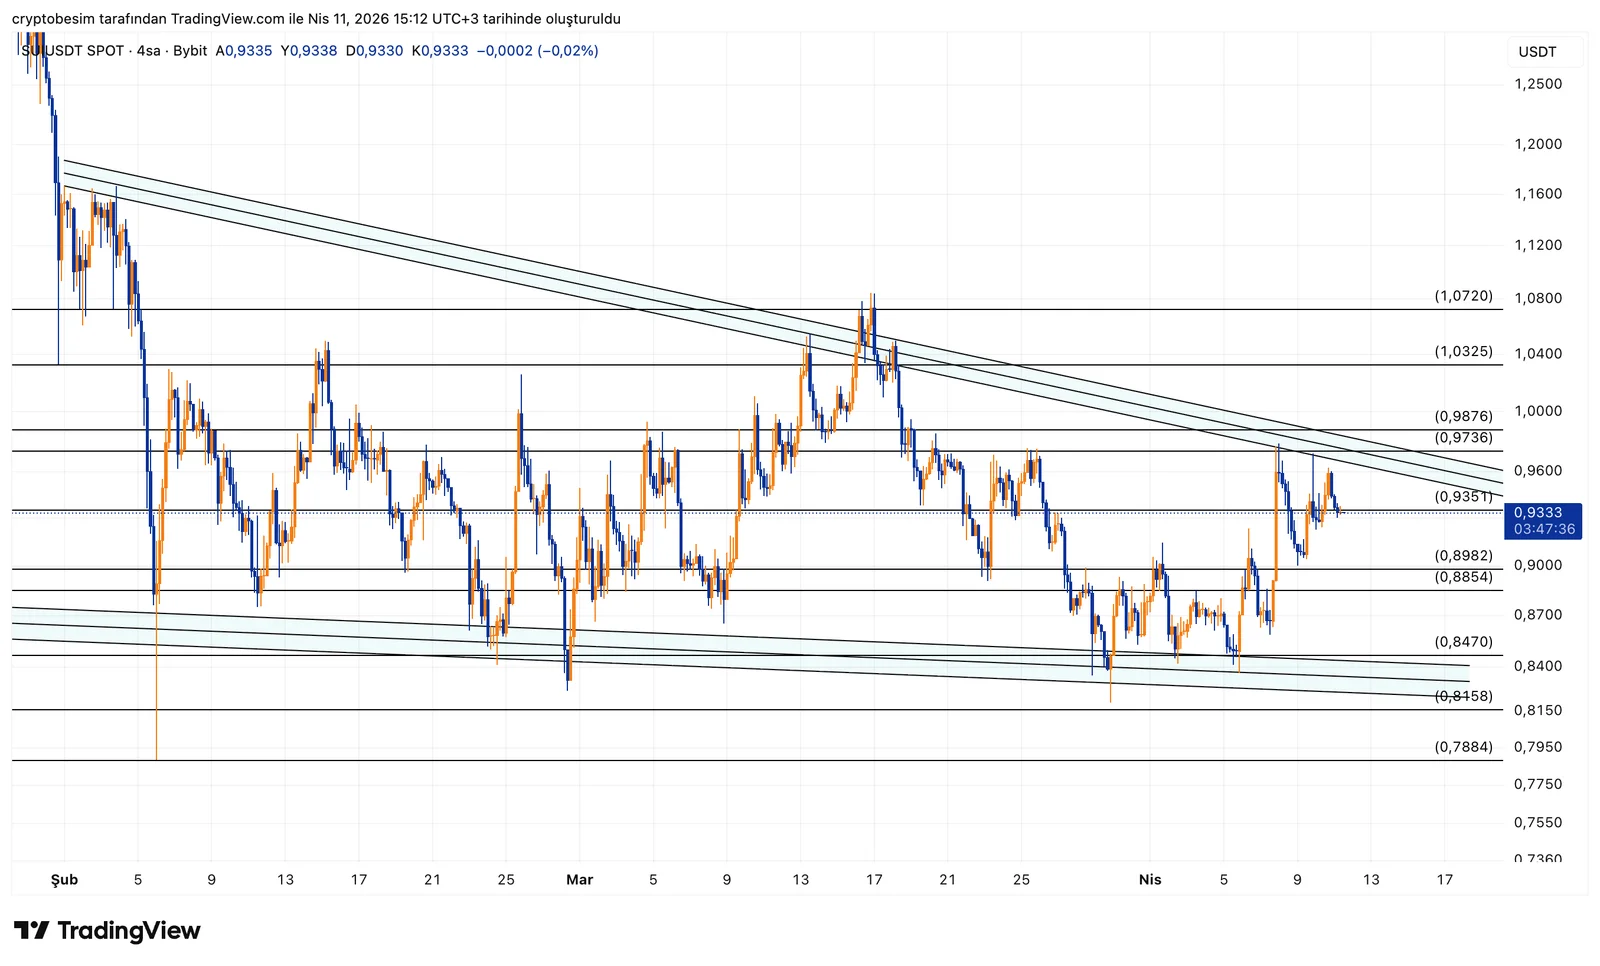
A clear symmetrical triangle structure stands out on the chart. The descending trendline from above is putting pressure on price, while the 0.84–0.85 region continues to act as strong support. In other words, the market has tightened significantly, and in these types of structures, price tends to accelerate once the breakout happens.
Currently, price is around 0.933, right at a decision point. The most critical short-term level is 0.935. This area is important because it is both a horizontal resistance and close to the upper boundary of the triangle. If price holds above it, the first target becomes the 0.973–0.987 range. If that area is also cleared, room opens toward 1.03 and 1.07. Especially a strong close above 0.97 with volume would clearly confirm an upside breakout.
On the downside, the 0.898–0.885 range is the first support zone. This is where buyers stepped in during the latest recovery. If price loses this area, the triangle would be considered broken to the downside and selling pressure could increase again. In that case, 0.847 comes first, followed by the major support at 0.815.
In summary:
- Above 0.935: the squeeze may resolve upward and momentum can accelerate
- Targets: 0.973 → 0.987 → 1.03 / 1.07
- Below 0.898: weakness begins
- If 0.885 breaks: risk of pullback toward 0.847–0.815 increases
The chart is currently very close to a breakout. At this stage, rather than predicting direction, it is healthier to follow the level that breaks.
These analyses do not provide investment advice and focus on support and resistance levels that are considered to offer short- and medium-term trading opportunities depending on market conditions. However, responsibility for execution and risk management lies entirely with the user. In addition, the use of stop loss is strongly recommended.


