
SUI 4H Technical Analysis – Descending Channel Pattern Formation and Price Compression Continue
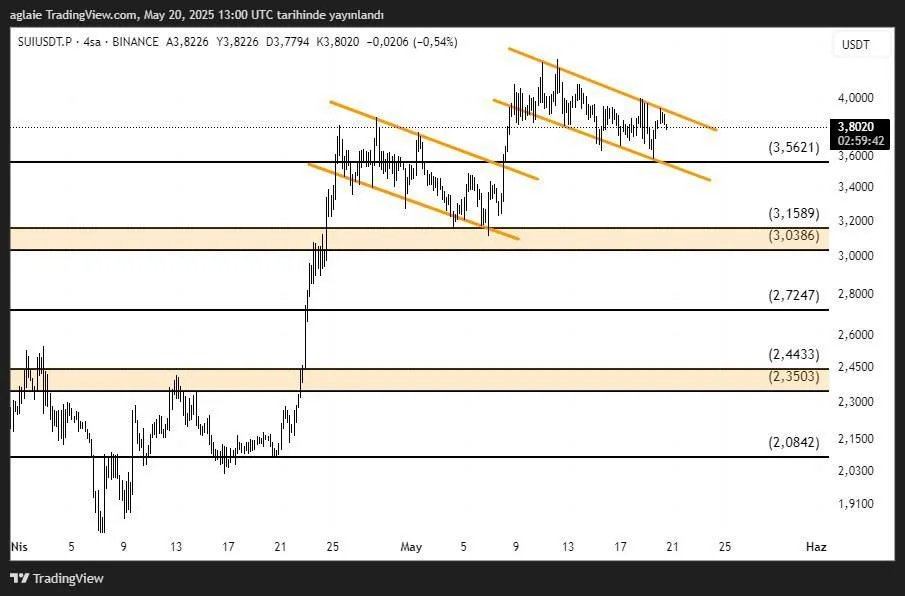
While SUI maintains its overall uptrend, a series of short-term corrections have formed a technically significant pattern. On the 4-hour chart, two consecutive descending channel pattern stand out. The first flag was broken to the upside, resulting in a strong rally. The second flag, however, is still active, with price currently moving within a tightening range.
SUI is trading around $3.80, and the upper boundary of the flag is being tested. A confirmed breakout above this level could indicate a continuation of the previous bullish leg. However, volume confirmation will be critical to validate the move.
Key Support Levels:
- $3.5621: Important short-term horizontal support
- $3.1589–$3.0386: Strong liquidity zone and previous consolidation range
- $2.7247: Mid-term support
- $2.4433–$2.3503: Key demand area in case of a deeper correction
Key Resistance Levels:
- $3.85–$3.90: Upper boundary of the flag, immediate breakout zone
- $4.00+: Psychological and technical target upon breakout
The formation of back-to-back descending channel patterns in SUI reflects a market structure where price consolidates before continuing upward. These patterns often indicate trend continuation, but as of now, the second flag has not been confirmed. If SUI breaks above $3.85 with rising volume, targets above $4.00 may quickly come into play.
In a bearish scenario, if the flag breaks downward, the price could first revisit the $3.56 support. Sustained movement below this level could push SUI toward the $3.15–$3.03 range.
Conclusion: SUI is at a critical decision point in the short term. A bullish breakout from the flag pattern could reignite upward momentum. On the other hand, increased selling pressure could lead to a test of key support zones. The $3.56 and $3.03 levels should be closely monitored for confirmation.
Disclaimer: This analysis does not constitute investment advice. It focuses on support and resistance levels that may present potential short- to mid-term trading opportunities depending on market conditions. However, all responsibility for trading decisions and risk management lies entirely with the user. The use of stop-loss orders is strongly recommended for any trade setup shared.


