
When analyzing SOL on the daily chart from a technical perspective, it is evident that the price has been maintaining the uptrend that began in mid-April. The current price is around $175.44, with a limited daily pullback of 0.26%. This pullback can be interpreted as a short-term correction. The price is currently trading near a critical resistance zonebetween $175 and $185. This area has previously acted as both support and resistance, making it a strong horizontal resistance zone.
Looking at technical levels, the nearest support level is at $167.79, which also stands out as a retracement area of the previous upward move. If the price falls below $167.79, it could retrace further towards the $146.78 – $139.96 range. This zone has previously attracted significant buying interest and may act as strong support. Additionally, the $124.40level remains an important long-term support on broader timeframes.
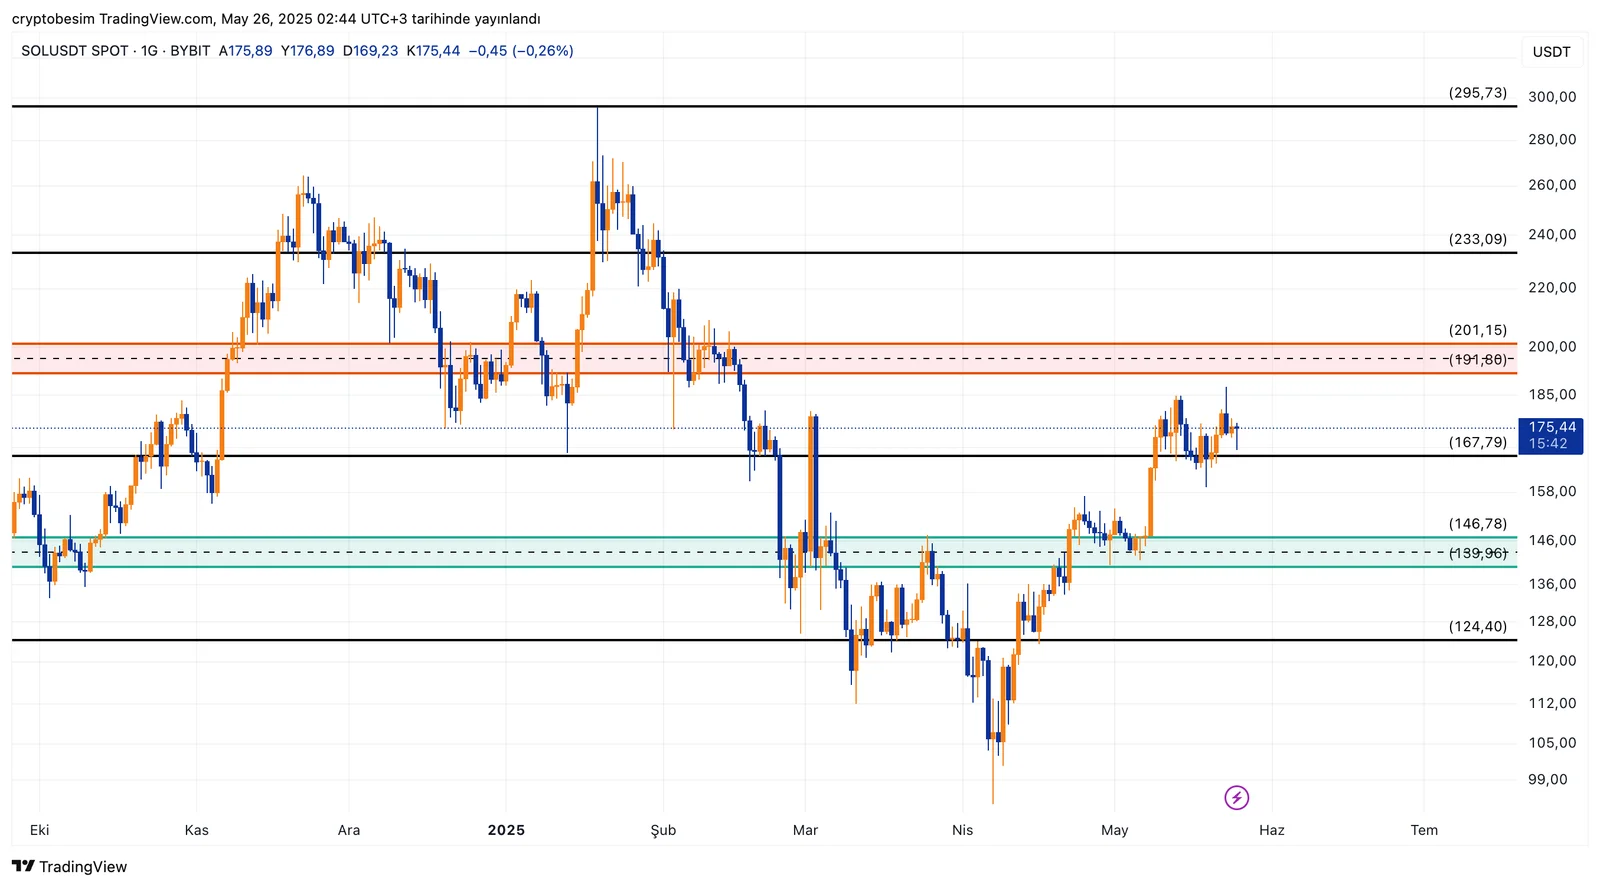
On the upside, if the price breaks above $175, the first target will be $191.80. Just above this lies $201.15, a strong resistance level. The $191.80 – $201.15 range is a horizontal resistance zone where the price has faced multiple rejections and reversals in the past. A breakout above this zone could signal a continuation of the strong bullish trendin Solana. If such a breakout occurs, medium-term targets could be $233.09 and eventually $295.73.
When examining the candlestick patterns on the chart, it is clear that the price has been facing resistance at the $175 level in recent days, yet bullish momentum remains intact. This may indicate that investors are consolidating strength to break through this level. If the price continues to hold above $167.79, the probability of an upward breakout increases.
In summary: Technically, SOL is in a strong recovery phase. In the short term, a break above the $175–$185 zonecould push the price above $200. However, if this zone fails to break, the price may pull back to $167.79 or even $146. Therefore, it is crucial for investors to closely monitor the price action between the $167.79 support and the $191.80 resistance. These breakouts will be key in determining the next direction.


