
When analyzing the daily chart of RENDER (RNDR) from a technical perspective, it is observed that the price has been moving within a long-standing descending channel structure, and recently, it has begun to tighten near the upper boundary of this channel. The current price is trading at $4.729, a level that is technically quite close to a critical decision point.
The first key horizontal support level highlighted on the chart is at $4.159. The price has managed to hold above this level, forming a short-term uptrend. Below this level, the $3.132 and $2.831 zones stand out as critical support areas. In particular, the $2.831 – $3.132 band has previously seen strong buying reactions, so it could serve as support in case of pullbacks.
On the upside, the $5.523 level emerges as the first major resistance point. This level coincides with the upper band of the descending channel, making it particularly critical from a technical standpoint. If $5.523 is broken, the next resistance levels will be $6.110, followed by $7.846. A breakout of these levels would confirm the end of the long-standing downtrend and could potentially push the price above $10 in the medium term.
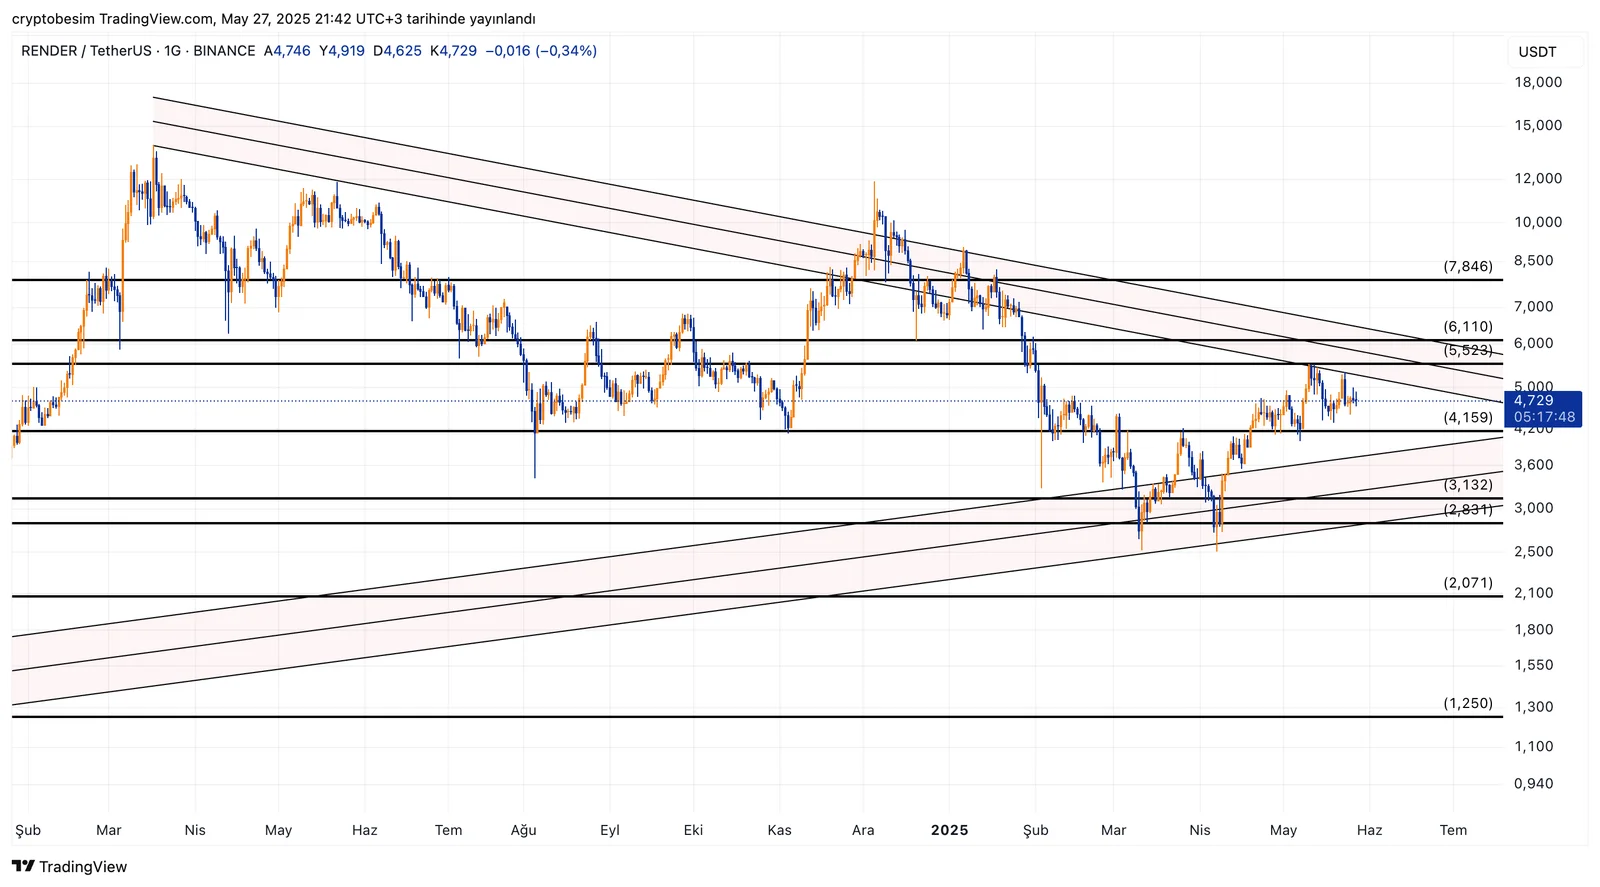
Additionally, the chart reveals a contracting symmetrical triangle structure. The price approaching the apex of this triangle suggests that a breakout may occur in the coming days. In the event of an upward breakout, the first target would be $6.110. However, in the case of a downward breakout, sustained movement below $4.159 could drag the price down to $3.132, and then to $2.071.
Volume analysis also shows that trading volume has decreased as the price approaches the narrowing region, which is typical behavior in triangle formations before a breakout. The direction of the breakout will determine the short- and medium-term trend.
In summary: RENDER is at a technical decision point. The price is very close to the apex of the contracting triangle, and the direction in which it breaks out is crucial. A break above $5.523 may trigger further upside, while a drop below $4.159 could deepen the decline. Investors are advised to closely monitor price action between these two levels. If accompanied by a spike in volume, the breakout direction will be confirmed.


