OP/USDT Technical Outlook
Optimism is once again on the agenda as one of the Layer-2 solutions that make Ethereum faster and cheaper. The Superchain network built on top of it still hosts hundreds of projects, and total transaction volume and liquidity remain at significant levels. Recently, Ripple’s RLUSD stablecoin expanded to OP Mainnet, which carries the potential to create more capital inflow on Optimism. In addition, the popular investment platform Robinhood listed the OP token for its users, making access easier and increasing investor interest.
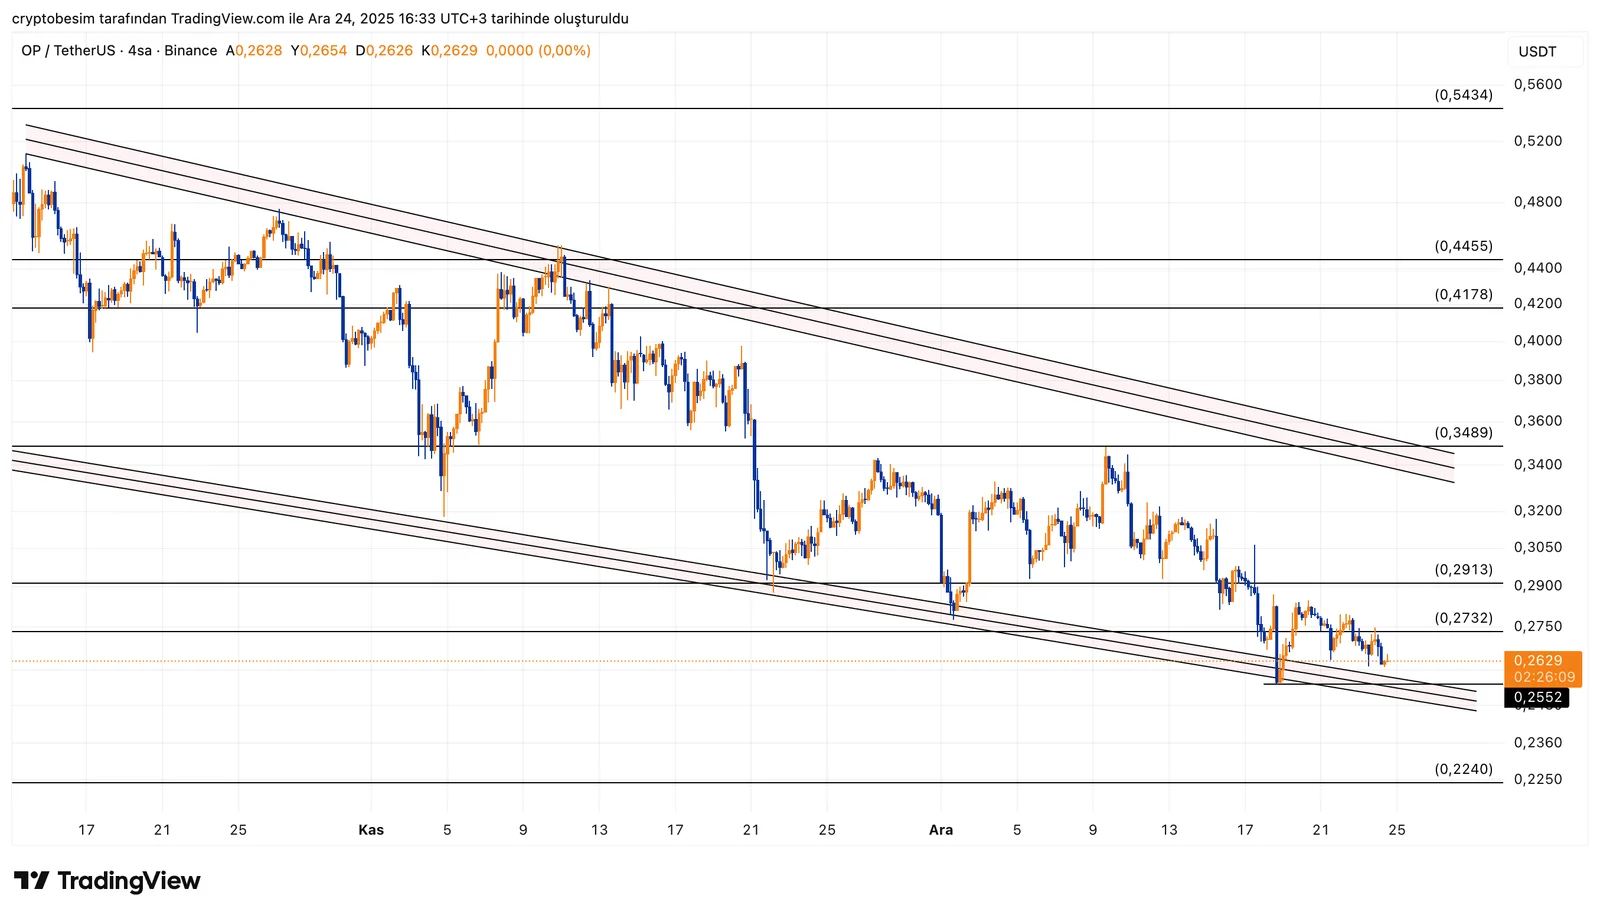
On the OP side, the structure is clearly seen as a descending wedge, and the price is currently trading very close to the bottom region of the formation. Despite the prolonged declines, in the latest candles we see that both momentum and selling pressure have weakened. This is a classic view suggesting that the wedge is approaching its final phase.
In the short term, the main area where the price is trying to hold:
- 0.26 – 0.25 band
This area corresponds both to the lower line of the descending wedge and to the region where recent lows were formed. As long as this level can be preserved, the formation remains technically valid and the possibility of an upward resolution stays on the table. As long as dips below are not permanent, an acceleration of the decline is not expected.
On the upside, the levels to be followed progress step by step:
- 0.29 – 0.30 first relief and short-term balance area
- 0.34 – 0.35 upper trend of the descending wedge and main decision zone
When the price reaches this upper trend region, it will be at a critical threshold in terms of the formation. A high-volume breakout coming here would mean an upward resolution of the descending wedge and allow the price to spread into a wider range. In such a scenario, the 0.41 – 0.44 band comes into play as a medium-term target.
In the downside scenario, the level to watch is clear:
- Closes below 0.25
In this case, the descending wedge breaks to the downside and the risk of a slide toward the 0.22 – 0.23 band increases. This region also serves as the last line of defense in the bigger picture.
In summary, OP is close to the bottom region within the descending wedge and at a decision stage. As long as the 0.26–0.25 band is preserved, the possibility of an upward resolution remains alive. The actual direction will be clarified by price behavior in the 0.34 – 0.35 region. If this area is surpassed, the structure changes; if it is not, the descending structure continues for a while longer.
These analyses, which do not provide investment advice, focus on support and resistance levels that are thought to create short- and medium-term trading opportunities depending on market conditions. However, the responsibility for trading and risk management belongs entirely to the user. In addition, it is strongly recommended to use stop loss for the positions shared.


