
LDO/USDT Technical Analysis
When we analyze the LDO chart on a daily time frame, we can see a descending channel pattern is still active. LDO has recently attempted to test the upper band of the channel yet it failed to break out, thus leading to a pullback confirming that the channel structure is working properly.
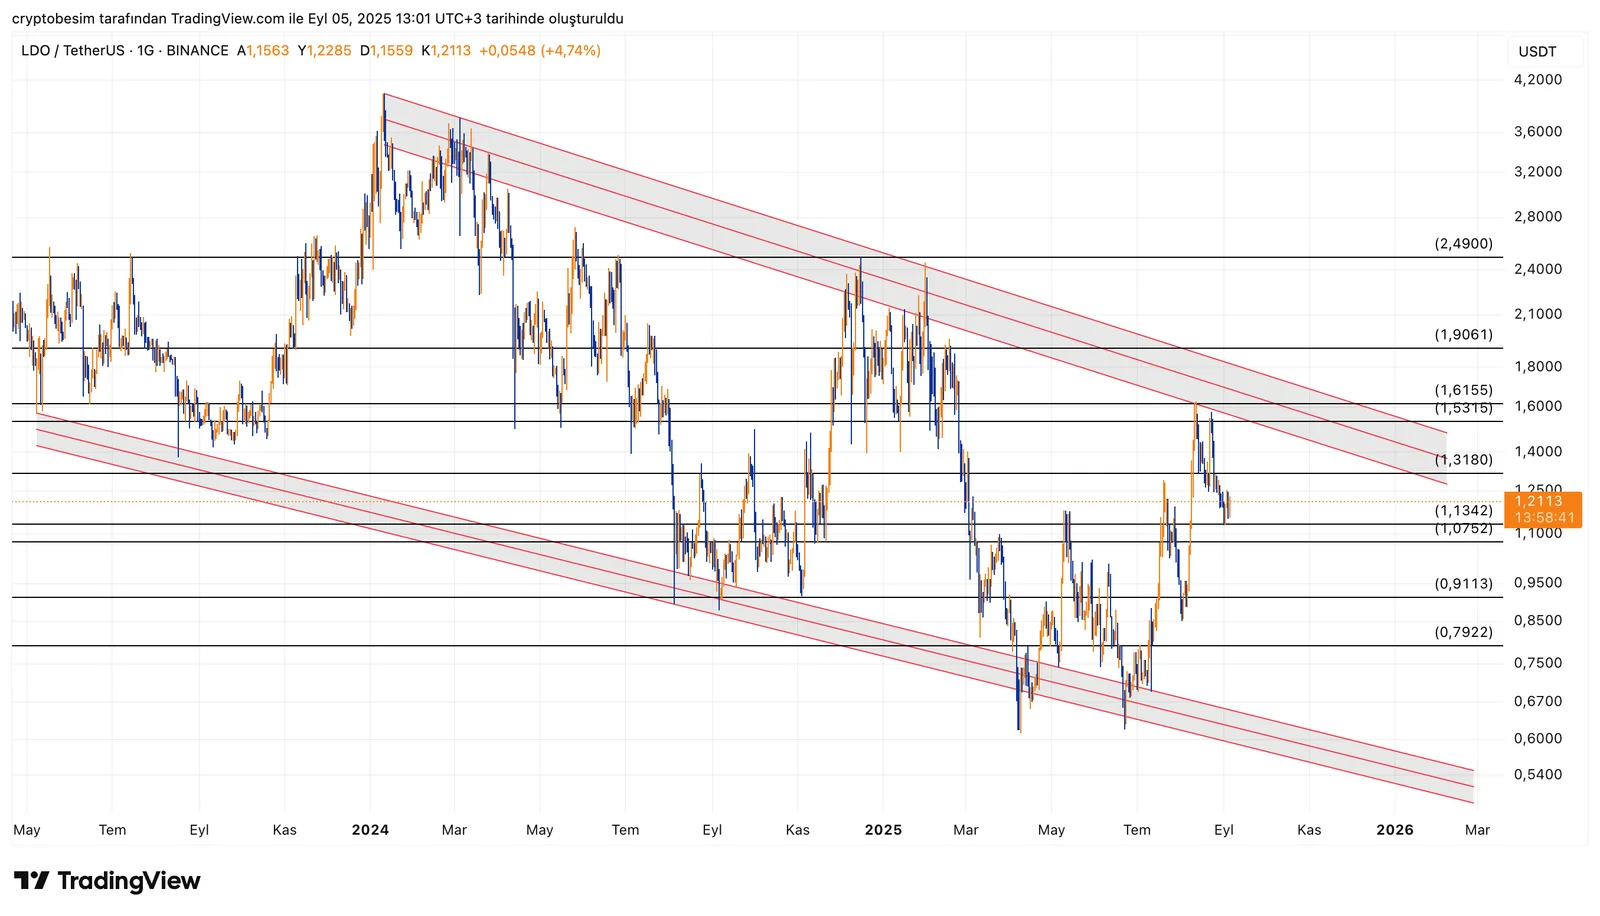
- We have the first support zone between the levels $1.13–$1.07 which can be considered a critical defense line as it intersects with the horizontal support and the middle band of the channel.
- Below this area stand other support levels $0.91 and $0.79.
According to a bullish scenario, the price is likely to test the upper band of the channel – $1.31. The price needs to break above $1.53 and $1.61 for the confirmation of actual breakout. In the event that this breakout occurs, then the price can surge to the level at $1.90. The ultimate target of this breakout will be the level at $4.0.In brief, LDO is still under pressure from its descending channel and support levels should be followed closely in the short term. Daily price closings above the level $1.53 would signal a trend shift and will pave the way for stronger bullish momentum upward.
These analyses, not offering any kind of investment advice, focus on support and resistance levels considered to offer trading opportunities in the short and medium term according to the market conditions. However, traders are responsible for their own actions and risk management. Moreover, it is highly recommended to use stop loss (SL) during trades.


