
INJ Technical Analysis
The Injective ecosystem has been drawing great attention these days. The reason for this is Canary Capital’s ‘Staked INJ ETF’ application filed yesterday to the SEC. This fund aims to reward investors through staking while also targeting to grow their returns based on price action. What’s more, this ETF application is the first staked INJ ETF filed in the US. Subsequent to this huge news, INJ jumped to a major resistance level. Now it is time to analyze the chart.
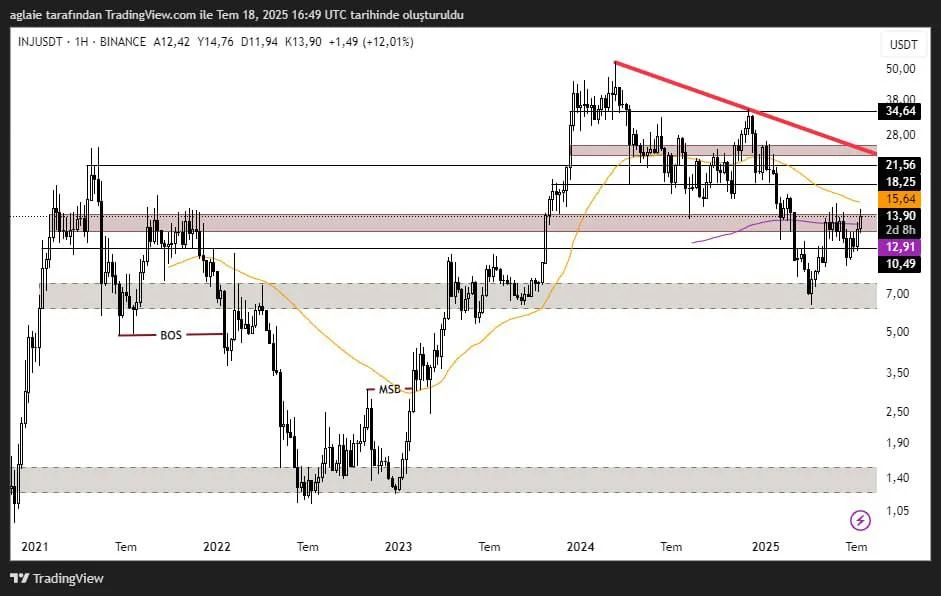
Looking at the chart on a weekly timeframe, we see that the price of INJ has surged to the level of $13.90. This price action suggests that the buy pressure from the level of $10.49 is gaining strength and the price is approaching the resistance zone again. The intersection of both the horizontal resistance and the bearish resistance at $15.64 will be vital for price direction ahead.
INJ is currently trading below MA50 and MA200 on the weekly timeframe, yet the breakout of these moving average levels upwards can be considered positive for the continuation of the price. If the price can break above the level of $15.64 with great momentum, the targets will be the price zone of $18–$21 to follow. Still, keep in mind that profit realizations are possible at this level.
These analyses, not offering any kind of investment advice, focus on support and resistance levels considered to offer trading opportunities in the short and medium term according to the market conditions. However, traders are responsible for their own actions and risk management. Moreover, it is highly recommended to use stop loss (SL) during trades.


